
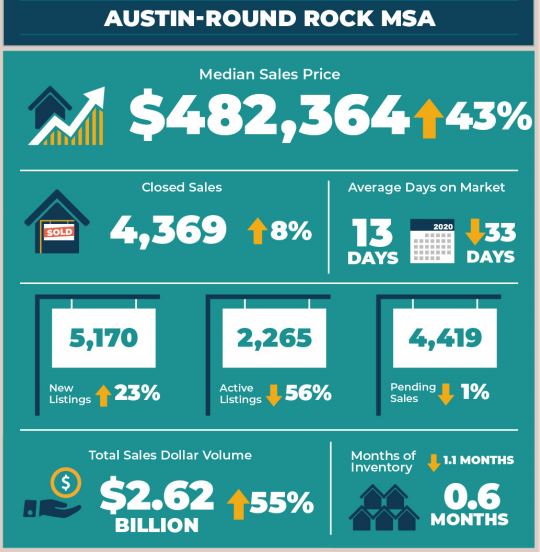
AUSTIN, Texas— According to the Austin Board of REALTORS® (ABoR) June and Midyear Central Texas Housing Market Report, 4,369 homes sold in June, a record for the month of June, across the Austin-Round Rock Metropolitan Statistical Area (MSA), an 8.6% increase year over year. The record setting number of transactions for any June on record contributed to an increase of 16.5% to 19,991 home sales during the first half of the 2021.

Across the five-county MSA in June, the median price increased 43% to $482,364—an all-time record. Sales dollar volume jumped 55.7% to $2,621,271,158, as pending sales slightly decreased 1.8% to 4,419. Housing inventory declined 1.1 months to 0.6 months of inventory. These numbers are consistent with a market that has seen more activity than ever before in recent months, and although the market is tight, more homes are being sold than in previous years.
“In June, and in the first six months of the year, we saw a confirmation that Austin’s housing market is one of the strongest in the nation,” Susan Horton, 2021 ABoR president said. “Our market has established its own new normal, as median prices climb while inventory remains low. With the unprecedented growth our region continues to experience, we can expect these trends to continue.”
According to Dr. Jessica Lautz, vice president, demographics and behavioral insights for the National Association of REALTORS®, buyers have shifted priorities since the onset of COVID-19, adding fuel to the housing market boom across the Austin-Round Rock MSA.
“The pandemic has changed buyer preferences. Reliable broadband access, at least one home office and flexible working and living spaces are top priorities. Remote work, along with incredibly low interest rates, has allowed buyers to purchase homes in suburban areas that provides more square feet, outdoor space, and increased buying power than in urban core areas.”
More homes are also being listed across the MSA, as new listings increased 23.8% to 5,170 listings in June 2021, while active listings dropped 56.3% to 2,265 listings. Homes spent an average of 13 days on market compared to 46 days for June 2020 indicating that as new homes are listed, they are quickly going under contract.
Even as more homes continue to be listed and transactions completed, Horton cautioned that more needs to be done to address affordability within the market.
“While we’re encouraged that housing has led our region’s economic recovery, action must be taken to bring more units on-line to meet the demand for housing and address affordability. Local leaders should collaborate regionally and with their state and federal partners to think creatively to address this complex issue. There is no ‘one-size-fits-all’ solution, but we must use all the tools available to us to employ an ‘all-of-the-above’ strategy. Addressing this challenge head on and prioritizing housing will go a long way to ensuring that our local economy remains healthy, our market reaches a more balanced position, and more people have access to homeownership.”
Austin-Round Rock MSA midyear performance
In the first half of 2021, homes sales in the Austin-Round Rock MSA increased 16.5% year over year to 19,991 home sales. Sales dollar volume climbed 59.6% to $11,093,848,341, while the median price increased 35.4% to $440,000. So far this year, new listings are up 5% to 23,897 new listings; active listings fell 70.7% to 1,622 listings; and pending sales increased 11.2% to 22,295 pending sales. Homes spent an average of 22 days on market from January-June 2021, 31 fewer days than the same time period in 2020.
City of Austin
In the City of Austin, home sales in the first half of the year increased 21.6% year over year to 6,467 sales, while the median price increased 30.9% to $530,000. At the same time, sales dollar volume skyrocketed 62.1% to $4,264,121,892. New listings increased 4.8% to 7,851 listings; active listings declined 56.5% to 603 listings; and pending sales increased 18.1% to 7,235 pending sales.
This June, there were 1,374 home sales, up 16.9% year over year, setting a record for any June on record. At the same time, sales dollar volume increased 63.8% to $969,626,439, while the median price jumped 42% to $575,000––an all-time record for the city of Austin. During the same period, new listings increased 15.2% to 1,672 listings; active listings tumbled 46.8% to 801 listings; and pending sales decreased 2.6% to 1,385 sales. Housing inventory decreased 0.8 months to 0.7 months of inventory.
Travis County
From January through June in Travis County, home sales increased 19.1% year over year to 10,072 sales. During the same period, sales dollar volume climbed 63.1% to $6,671,909,136, as the median price rose 32.5% to $510,186. New listings saw an uptick of 1.7% to 11,931 listings, while active listings dropped 64.2% to 910 listings. Pending sales increased 11.1% to 10,904 pending sales.
In June 2021, home sales increased 8.5% year over year to 2,123 sales, while sales dollar volume climbed 54.7% to $1,516,750,182. During the same period, the median price increased 42.7% to $560,000. New listings increased 20% to 2,600 listings; active listings fell by half, 50%, to 1,290; while pending sales slightly decreased 4.6% to 2,106 pending sales. Housing inventory fell 1.0 months to 0.7 months of inventory.
Williamson County
In Williamson County, home sales in the first half of 2021 increased 11.4% year over year to 6,554 home sales. During the same period, sales dollar volume increased by 54.7% to $2,965,504,661, and the median price increased 42.1% to $414,936. New listings decreased 8.5% to 7,967 listings; active listings dropped 77.9% to 394 listings, while pending sales increased 8.2% to 7,441 pending sales.
In June 2021, home sales increased 11.4% year over year to 1,539 sales. During the same period, sales dollar volume jumped 62.8% to $764,342,867, and the median price climbed 47.5% to $450,000. New listings increased 25.5% to 1,759, while active listings tumbled 61.6% to 605 listings. Pending sales increased 3% to 1,576 pending sales. Housing inventory fell by one month to 0.5 months of inventory.
Hays County
In the first half of 2021, Hays County home sales rose 12.2% year over year to 2,395 sales, and sales dollar volume rose 49.7% to $1,128,078,444. During the same period, the median price increased 27.2% to $355,000. New listings increased 10.6% to 2,956 listings; active listings fell 76% to 195 listings; and pending sales increased 14.5% to 2,887 pending sales.
In June 2021, home sales decreased 4.7% year over year to 509 home sales, as sales dollar volume climbed 36% to $260,278,016. During the same period, the median price rose by 37.6% to $395,000. New listings increased 44% to 609 listings; active listings fell 63.8% to 243 listings; and pending sales slightly increased 0.4% to 557 pending sales. Inventory dropped 1.3 months to 0.6 months of inventory.
Bastrop County
In the first half of 2021, Bastrop County home sales increased 45% year over year to 786 home sales, and sales dollar volume increased 76.9% to $267,436,457. The median sales price increased 13.7% to $290,000. During the same period, new listings increased 7.1% to 858 listings, as active listings dropped 72.5% to 88 listings. At the same time, pending sales increased 32% to 879 pending sales.
In June 2021, home sales increased 32.8% year over year to 158 home sales, and sales dollar volume soared 85.2% to $62,643,784. At the same time, the median price increased 24.8% to $322,500. New listings increased 5.4% to 156 listings; active listings fell 65.3% to 96 active listings, while pending sales fell 16.6% to 136 pending sales. Inventory declined 2.2 months to 0.7 months of inventory.
Caldwell County
To date in 2021, Caldwell County home sales increased 22.7% year over year to 184 sales, and sales dollar volume increased 52.2% to $56,325,075. The median price climbed 18.8% to $250,000. During the same period, new listings dropped 11.5% to 185 listings; active listings declined 63.2% to 32 listings, while pending sales increased 4.6% to 184 pending sales.
In June 2021, home sales increased 17.7% year over year to 40 home sales, and sales dollar volume jumped 76.4% to $14,784,567. During the same period, the median price rose 38.3% to $295,000. New listings increased 21.1% to 46 listings; active listings decreased 60.8% to 31 listings. Pending sales increased 2.3% to 44 pending sales. Housing inventory fell 2.2 months to 0.9 months of inventory.
For more information or to download the June and Midyear 2021 Central Texas Housing Market Report, visit ABoR.com/MarketStatistics.