
AUSTIN, Texas – Residential home sales decreased across the Austin-Round Rock Metropolitan Statistical Area (MSA) for the first time since May 2020, according to the Austin Board of REALTORS® July 2021 Central Texas Housing Report. Despite the dip, the five-county MSA was just 445 homes shy of breaking the all-time home sales record set in July 2020.

“July 2020 established the all-time-high watermark for home sales in the region due to pent-up housing demand after several months of stay at-home orders and increased consumer purchasing power,” Susan Horton, 2021 ABoR President, said. “As we have moved away from the post-COVID boom, the market has begun to stabilize. The typical seasonality for the summer returned as people re-engaged in other activities, including travel. There are fewer instances of dozens of offers over list price even as home prices continue to rise, albeit at a slower rate month to month than the surge experienced in the first half of the year.”
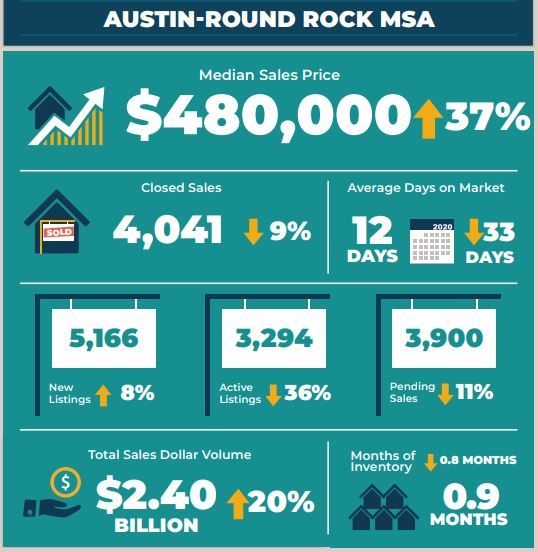
As residential home sales in the Austin Round-Rock MSA declined 9.9% to 4,041, the median sales price jumped 37.1% year over year to $480,000—a record for the month of July. At the same time, sales dollar volume increased 20.7% year over year to $2,409,491,114. Monthly housing inventory dipped 0.8 months to 0.9 months of inventory. While the inventory remains well below a healthy average, inventory has slightly increased since the first half of 2021.
Vaike O’Grady, regional director of MetroStudy, said that while the frenzy to buy a home in Austin has steadied from this time last year, it’s unlikely that home prices will go down any time soon.
“Austin is always considered one of the top places to live in the U.S., but we’re losing ground due to shrinking housing inventory and affordability. With construction delays and regulatory barriers, builders and developers are having increasing difficulty getting new homes on the ground. Because of that, there’s not enough supply coming to the market to significantly impact available inventory, which further pushes prices up. Looking ahead, there will likely only be new inventory available further out in the suburbs; meaning, other submarkets may gain traction over Austin.”
In July, new listings increased 8.2% to 5,166 listings; active listings dropped 36.9% year over year to 3,294 listings; and pending sales declined 11% to 3,900 listings. Homes only spent an average of 12 days on market last month across the MSA.
Horton stated that what our market is experiencing isn’t just an Austin phenomenon, but occurring elsewhere, too.
“Seasonality has a hand in the increasing home sales growth across our region and nationally. Compared to the early pandemic days, the pace of homebuying activity has slowed across the U.S. If you’re looking to buy or rent a home, don’t miss this opportunity to take advantage of the market’s slower pace. If you’re looking to sell, don’t mistake this dip as a cool down—it’s still an excellent time to sell a home. Our market is still difficult to navigate, so it’s always best to enlist the expertise of a REALTOR®.”
City of Austin
In the city of Austin, the median home price rose 37.6% year over year to $574,975—a record for the month of July. Home sales decreased 10.2% to 1,304 sales, while sales dollar volume increased 15.8% to $903,215,913. During the same period, new listings decreased 3% to 1,608 listings, active listings dropped 35.2% to 1,066 listings, and pending sales decreased 10.2% to 1,214 pending sales. Monthly housing inventory decreased 0.8 months year over year to 0.9 months of inventory.
Travis County
At the county level, home sales also decreased 12.1% to 1,954 sales, and sales dollar volume jumped 14.7% to $1,379,355,724. The median price for a home increased 34.4% year over year to $551,000. During the same period, new listings increased 2.1% to 2,566 listings; active listings declined 34.5% to 1,745 listings; and pending sales decreased 11.2% to 1,935 pending sales. Monthly housing inventory decreased 0.7 months year over year to 1.0 months of inventory.
Williamson County
In Williamson County, July home sales decreased 4.9% to 1,451 sales, while sales dollar volume jumped 38.1% to $719,024,219. The median price rose 43.4% to $445,000, and new listings increased 20.2% to 1,740 listings. At the same time, active listings fell 32.9% to 1,002 listings, and pending sales also decreased 11.9% to 1,284 pending sales. Housing inventory declined 0.6 months year over year to 0.8 months of inventory.
Hays County
In Hays County, July home sales decreased 14.6% to 464 sales, and sales dollar volume climbed 13% to $245,922,935. The median price for homes increased 26.9% to $392,576. During the same period, new listings rose 6.7% to 622 listings, while active listings decreased 41.9% to 387 listings. At the same time, pending sales decreased 16.9% to 483 pending sales. Housing inventory decreased 1.0 months to 0.9 months of inventory.
Bastrop County
In July, Bastrop County home sales decreased 8.7% to 147 sales, and sales dollar volume rose 16.3% to $55,506,817. The median price increased 30.1% to $345,500. During the same period, new listings decreased 5.8% to 180 listings, while active listings declined 65.2% to 111 listings. Pending sales rose 20.2% to 155 pending sales. Housing inventory decreased by 2.5 months to 0.8 months of inventory.
Caldwell County
In Caldwell County, July home sales decreased 26.5% to 25 sales, and sales dollar volume increased 3.4% to $7,677,865. The median home price increased 22.2% year over year to $249,250. At the same time, new listings increased 56.8% to 58 listings, while active listings decreased 36.4% to 49 listings. Pending sales increased 16.2% to 43 pending sales, and housing inventory decreased 1.4 months to 1.6 months of inventory.
For more information or to download the July 2021 Central Texas Housing Market Report, visit ABoR.com/MarketStatistics.