
AUSTIN, Texas — According to the Austin Board of REALTORS®October 2022 Central Texas Housing Market Report, median home prices across the MSA continued their recent trend of more stable and sustainable appreciation even while hitting $474,900—a record for the month of October. The data indicates the continued return to normal activity, with inventory also rising to 3.2 months of inventory, half the amount of housing inventory needed for a market to be considered balanced.

Last month, sales dollar volume fell by 24.6% to $1,346,229,031 as new listings declined 13.1% to 3,255 listings across the MSA. The median price increased by only 4.9% to $474,990—setting a median price record for the month of October. Pending listings dropped by 40.0% to 2,141 listings and available inventory increased by 2.2 months to 3.2 months of inventory.
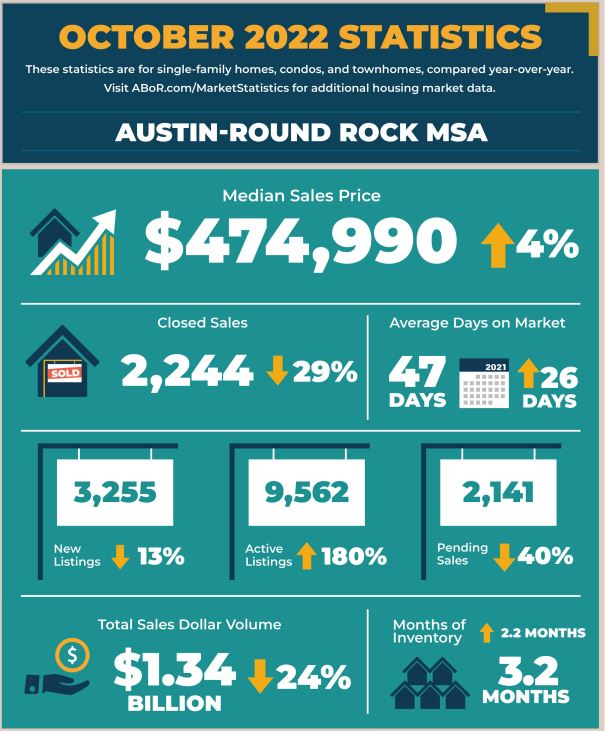
In October, homes spent an average of 47 days on market, up 26 days from October 2021.
City of Austin
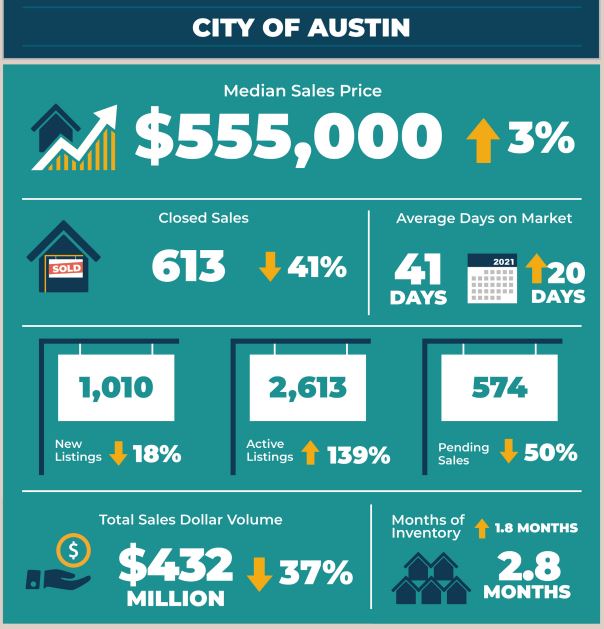
In October, home sales decreased 41.3% to 613 sales, while sales dollar volume decreased 34.7% to $432,352,496. At the same time, median price rose 3.8% setting a record for the month of October of $555,000 for the City of Austin. Last month, new listings slightly dropped 18.4% to 1,010 listings, active listings skyrocketed 139.1% to 2,613 listings as pending sales declined by 50.9% to 574 pending sales. Monthly housing inventory increased 1.8 months year over year to 2.8 months of inventory.
Travis County
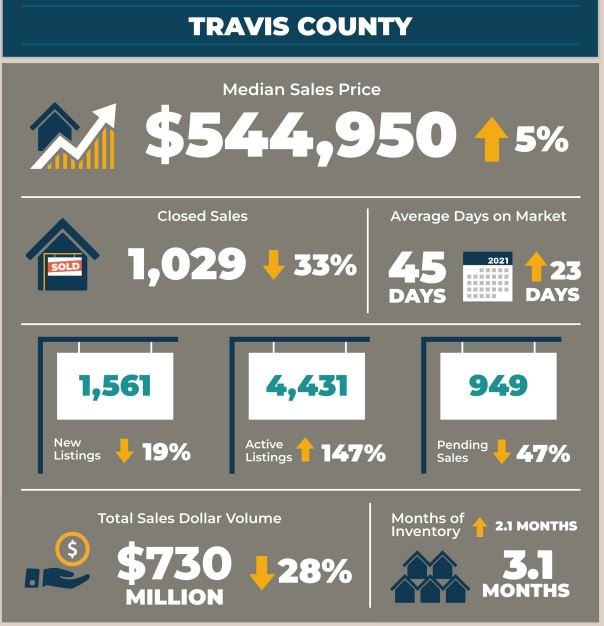
In Travis County, home sales decreased 33.4% to 1,029 sales, while sales dollar volume decreased 28.0% to $730,178,298. Last month, median price in Travis County rose 5.8% year over year to $544,950 as new listings decreased 19.4% to 1,561 listings and active listings ballooned 147.7% to 4,431 listings year over year. Pending sales declined 47.7% to 949 pending sales as monthly housing inventory increased 2.1 months year over year to 3.1 months of inventory.
Williamson County
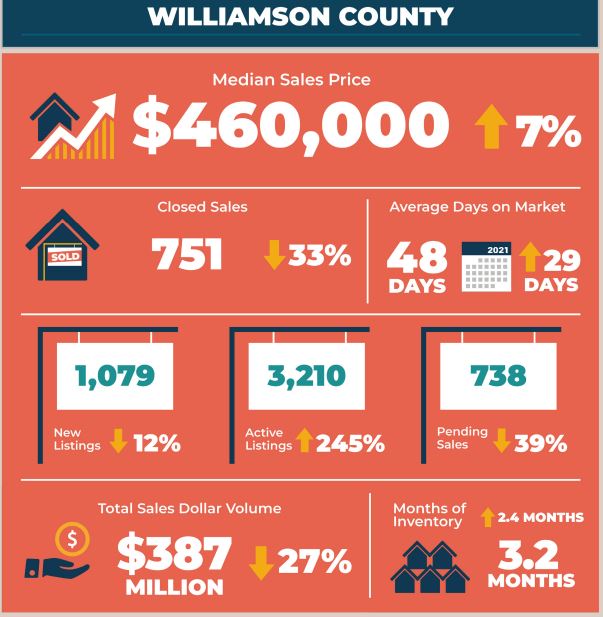
October home sales decreased 33.3% to 751 sales in Williamson County. Sales dollar volume declined 27.3% year over year to $387,991,758. The median price increased 7.0% to $460,000 as new listings dropped 12.8% to 1,079 listings. During the same period, active listings soared 245.9% to 3,210 listings while pending sales dropped 39.4% to 738 pending sales. Housing inventory rose 2.4 months to 3.2 months of inventory.
Hays County
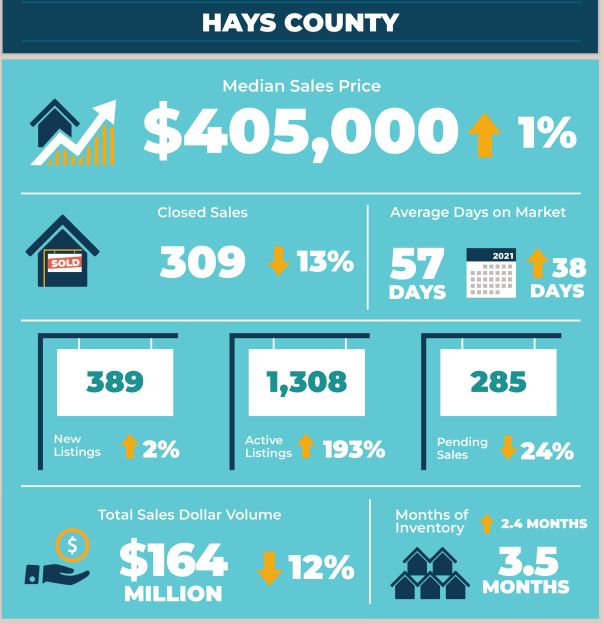
In Hays County, October home sales decreased 13.5% to 309 sales and sales dollar volume also slightly decreased 12.7% to $164,078,130. The median price for homes rose 1.4% to $405,000. During the same period, new listings increased 2.6% to 389 listings, while active listings skyrocketed by 193.9% to 1,308 listings. Pending sales decreased 24.6% to 285 pending sales as housing inventory jumped by 2.4months to 3.5 months of inventory.
Bastrop County
Last month, Bastrop County home sales increased 8.2% year over year to 119 sales, while sales dollar volume also rose by 25.5% to $51,072,224. Median price increased 10% to $365,138 as new listings rose 12.5% to 171 listings. Active listings soared 144.8% to 492 listings as pending sales slightly increased 0.8% to 131 pending sales. Housing inventory increased 2.3 months to 3.8 months of inventory, the highest level of inventory across the MSA in October.
Caldwell County
In Caldwell County in October, home sales increased 9.1% to 36 home sales, and sales dollar volume dropped 12.2% to $11,639,809. The median home price rose 9.8% year over year to $319,000. At the same time, new listings increased by 34.2% to 55 listings as active listings skyrocketed 168.9% to 121 listings. Pending sales increased 35.7% to 38 pending sales, and housing inventory increased 1.4 months to 2.9 months of inventory.
For more information or to download the October 2022 Central Texas Housing Market Report, visit ABoR.com/MarketStatistics.