As we wrap up the first quarter of 2025, it’s time to zoom into March — a pivotal month in the real estate cycle — and take a deep dive into how the Travis Couty real estate market has evolved over the past three years. Here’s a breakdown of what’s happening with median sale prices, inventory levels, closed sales, and more, and what it all means for buyers, sellers, and investors.

March Year-over-Year Comparison (2025 vs 2024 vs 2023)
| Metric | March 2023 | March 2024 | March 2025 | YoY Change (2024– 2025) |
|---|---|---|---|---|
| Median Sales Price | $514,900 | $510,000 | $529,950 | ▲ +3.9% |
| Closed Sales | 1,262 | 1,190 | 1,117 | ▼ -6.1% |
| Sales Volume ($B) | $0.851B | $0.828B | $0.807B | ▼ -2.5% |
| Months of Inventory | 3.1 | 4.1 | 5.3 | ▲ +1.2 |
| New Listings | 2,250 | 2,320 | 2,658 | ▲ +14.6% |
| Active Listings | 3,775 | 4,695 | 5,735 | ▲ +22.1% |
Key Takeaways:
- Prices have rebounded after a dip in 2024, with a 3.9% increase YoY.
- Sales activity is cooling, with a consistent drop in closed sales over the last two years.
- Inventory continues to rise, reflecting a shift toward a more balanced or even buyer-favored market.
- Homes are selling slightly faster, possibly due to sellers becoming more competitive with pricing and marketing.
Median Sale Price Trend
Over the past three years, the median sale price showed a roller-coaster pattern:
- Peaked in May 2022 at $659K, then dropped sharply.
- Bottomed out in Jan 2025 at $475K — a nearly 28% decline from the peak.
- Recent uptick in March 2025 to $529,950 shows signs of recovery.
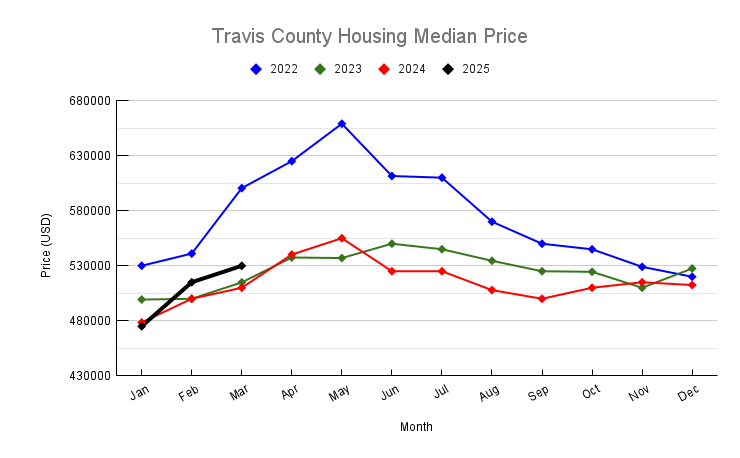
Interpretation: The price correction from the overheated 2022 market has stabilized, and 2025 could see a modest upward trend if buyer activity picks up, particularly with mortgage rates stabilizing.
Months of Inventory Trend
This metric reflects the balance between supply and demand:
- March 2022: 0.5 months (extreme seller’s market)
- March 2023: 3.1 months (shifting market)
- March 2024: 4.1 months
- March 2025: 5.3 months (approaching buyer’s market territory)

Interpretation: Inventory has increased by over 950% since March 2022. With more choices and less urgency, buyers now have stronger negotiating power.
Closed Sales Trend
- March 2022: 1,615 closed
- March 2023: 1,262 closed
- March 2024: 1,190 closed
- March 2025: 1,117 closed
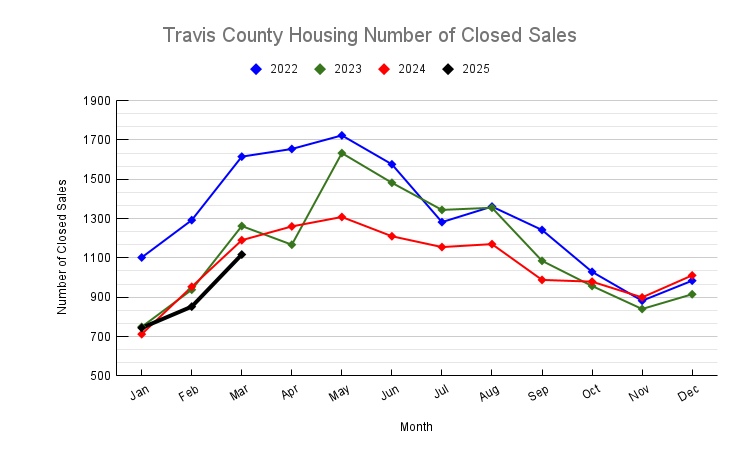
Interpretation: There’s a consistent downward trend in buyer activity. Factors may include affordability constraints, tighter lending standards, or simply more time to decide in a less competitive market.
New Listings Trend
- March 2022: 2,048
- March 2023: 2,250
- March 2024: 2,320
- March 2025: 2,658
Interpretation: Despite slower sales, new listings keep rising, suggesting that more homeowners are ready (or feel compelled) to sell — possibly due to changing life circumstances or expectations of rising competition.
Conclusion
The March 2025 Travis County real estate market is emblematic of a correcting and rebalancing housing landscape. The frenzy of 2022 has cooled, prices have found a floor, and inventory is on the rise. For sellers, pricing strategy and property presentation are now more important than ever. For buyers, there’s finally time to breathe, compare, and negotiate.
If you have any questions or need any assistance in finding your new home or investment property, please contact me and I will be more than happy to work with you. You can read my client testimonials here.
Please also check out our rebate program which is a win-win situation for my buyer.