
AUSTIN, Texas — Austin-Round Rock MSA housing inventory topped 3.0 months in March, while an increase in new and active listings indicates favorable market conditions for buyers and sellers, according to the Austin Board of REALTORS® latest Central Texas Housing Report.

In March, 4,385 residential properties hit the market, an increase of 6.6% listings from the year prior. Active listings soared 377.7% to 8,059 listings, pushing the region’s housing inventory up from 0.5 months to 3.0 months of inventory across the five-county area. Pending sales declined 7.4% to 3,046 transactions, while homes spent an average of 80 days on the market, up 58 days from March 2022.
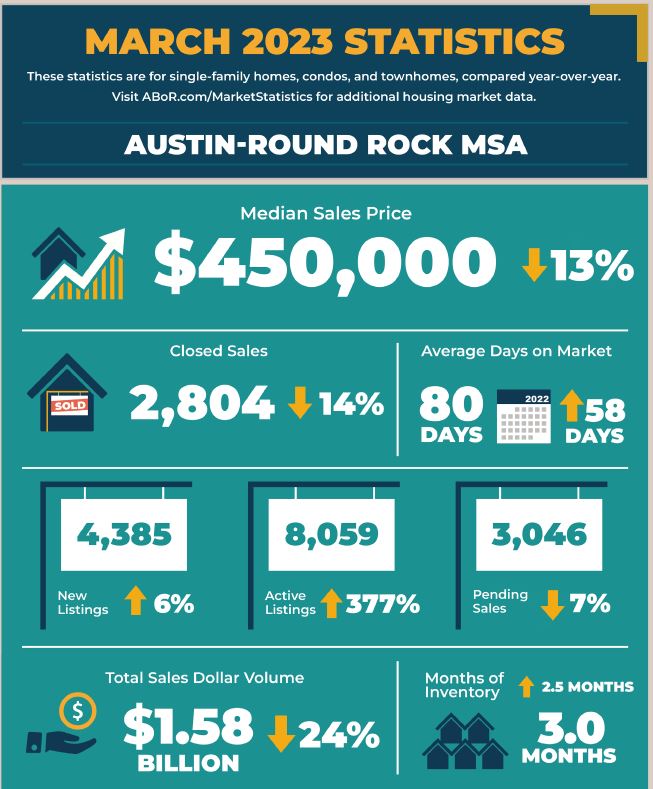
At the same time, residential home sales declined 14.0% year-over-year to 2,804 closed sales, median price declined 13.5% to $450,000, and sales dollar volume dropped 24.9% to $1,580,024,101.
City of Austin
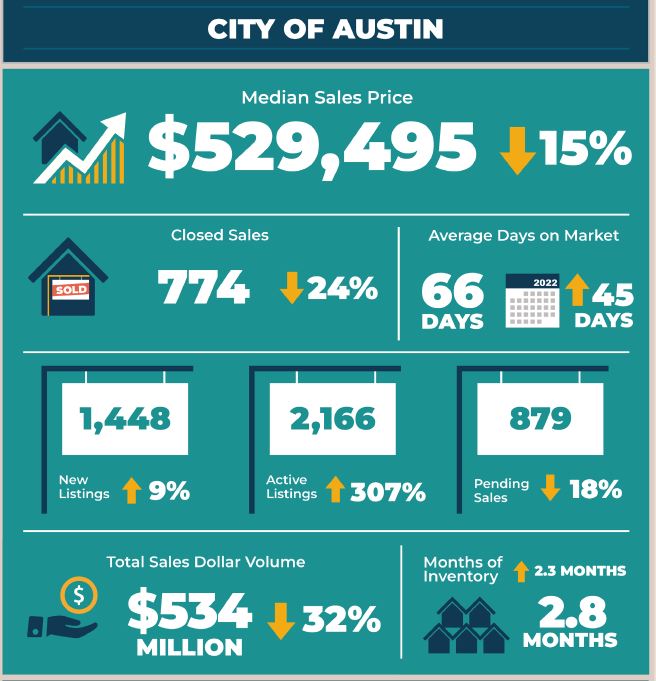
In March, home sales decreased 24.6% to 774 sales, while sales dollar volume decreased 32.6% to $534,646,203. At the same time, the median price decreased 15.1% to $529,495 for the City of Austin. Last month, new listings ticked up 9.9% to 1,448 listings, active listings skyrocketed 307.9% to 2,166 listings as pending sales declined by 18.8% to 879 pending sales. Monthly housing inventory increased 2.3 months year over year to 2.8 months of inventory.
Travis County
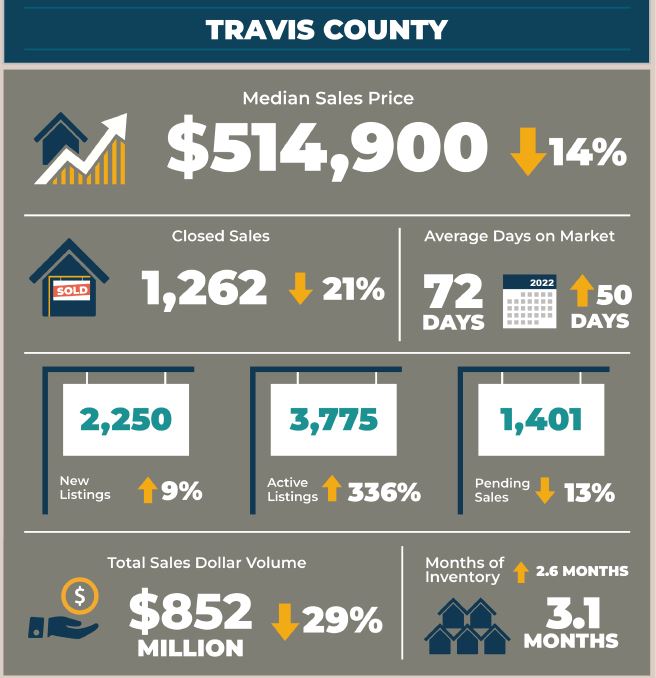
In Travis County, home sales decreased 21.1% to 1,262 sales, while sales dollar volume decreased 29.0% to $852,870,042. Last month, the median price in Travis County dropped 14.2% year over year to $514,900, while new listings increased 9.9% to 2,250 listings and active listings ballooned 336.9% to 3,775 listings year over year. Pending sales declined 13.0% to 1,401 pending sales as monthly housing inventory increased 2.6 months year over year to 3.1 months of inventory.
Williamson County
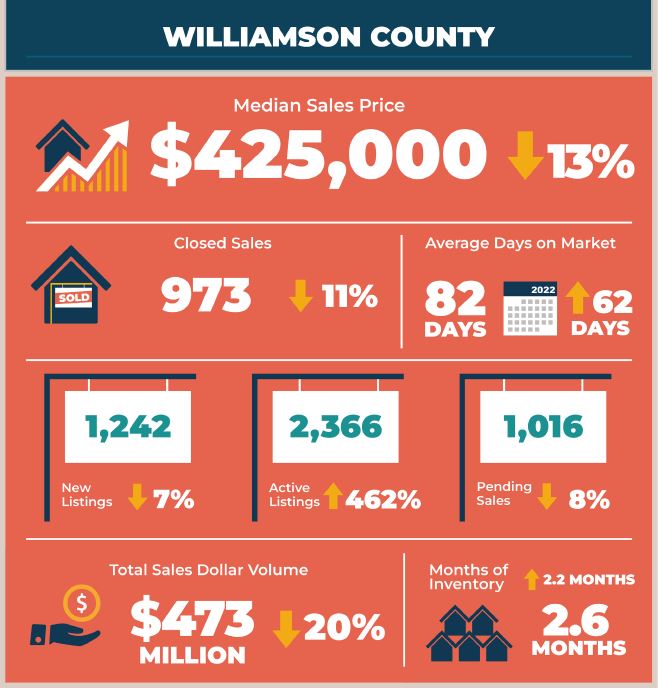
March home sales decreased 11.9% to 973 sales in Williamson County. Sales dollar volume declined 20.8% year over year to $473,710,413. The median price decreased 13.0% to $425,000 and new listings fell 7.2% to 1,242 listings. During the same period, active listings soared 462.0% to 2,366 listings while pending sales dropped 8.7% to 1,016 pending sales. Housing inventory rose 2.2 months to 2.6 months of inventory.
Hays County
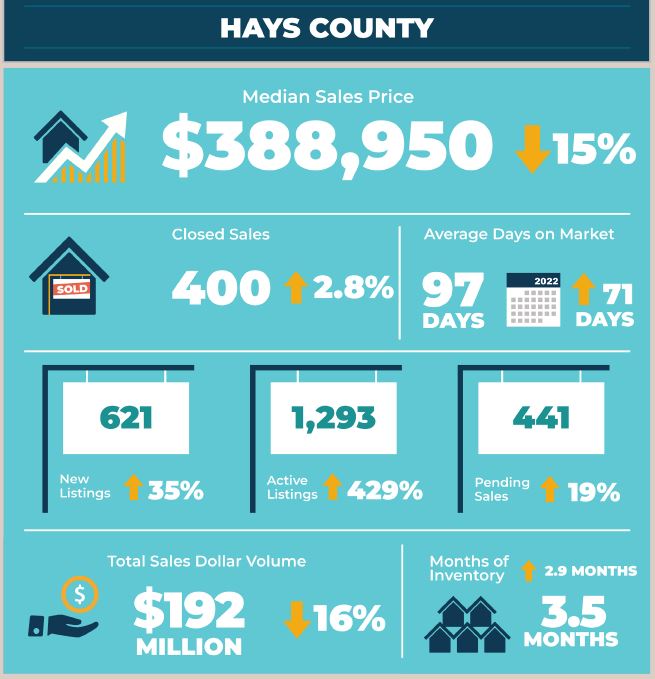
In Hays County, March home sales increased 2.8% to 400 sales and sales dollar volume dropped 16.4% to $192,017,930. The median price for homes fell 15.5% to $388,950. During the same period, new listings increased 35.6% to 621 listings, while active listings skyrocketed by 429.9% to 1,293 listings. Pending sales decreased 19.5% to 441 pending sales as housing inventory jumped by 2.9 months to 3.5 months of inventory.
Bastrop County
Last month, Bastrop County home sales slightly increased 0.8% year over year to 129 sales, while sales dollar volume fell by 19.3% to $47,335,700. The median price decreased 17.5% to $329,990 as new listings ticked up 9.8% to 213 listings. Active listings soared 301.6% to 506 listings as pending sales slightly increased 4.6% to 137 pending sales. Housing inventory increased by 3.1 months to 4.1 months of inventory, the highest level of inventory across the MSA in March.
Caldwell County
In Caldwell County, home sales slightly decreased 4.8% year over year to 40 sales, and sales dollar volume also dropped 20.5% to $13,129,260. The median home price fell 8.4% year over year to $298,750. At the same time, new listings decreased by 23.4% to 59 listings as active listings skyrocketed 271.9% to 119 listings. Pending sales decreased 22.7% to 51 pending sales, and housing inventory increased 1.8 months to 2.8 months of inventory.
For more information or to download the March 2023 Central Texas Housing Market Report, visit ABoR.com/MarketStatistics.