The latest data from the Austin Board of REALTORS (ABOR MLS) provides a clear picture of how the Travis County residential real estate market is evolving as we begin 2026. After several years of dramatic shifts — from the intense seller’s market of 2022 to the inventory-heavy conditions of 2024 and 2025 — January 2026 reveals a market still adjusting.

Let’s break down the numbers and analyze the key trends.
1. Year-Over-Year Comparison: January 2026 vs. 2025 and 2024
Median Sales Price
- January 2026: $445,000
- January 2025: $475,000
- January 2024: $478,500
The median price declined 6.3% year-over-year from 2025 and is down roughly 7% compared to 2024. This marks a continued cooling trend and places prices well below the 2022 peak levels.
Closed Sales
- January 2026: 684
- January 2025: 744
- January 2024: 712
Closed sales fell 8% compared to 2025 and are down slightly from 2024. Buyer activity remains somewhat subdued.
Sales Dollar Volume
- January 2026: $0.45B
- January 2025: $0.492B
- January 2024: $0.447B
Dollar volume is slightly below 2025 and nearly flat compared to 2024, reflecting both lower prices and reduced transaction counts.
Months of Inventory
- January 2026: 3.9 months
- January 2025: 6.2 months
- January 2024: 3.4 months
Inventory has improved significantly from 2025’s elevated levels but remains higher than early 2022 conditions. The market is trending toward balance.
New Listings
- January 2026: 1,624
- January 2025: 1,779
- January 2024: 1,398
New listings decreased compared to 2025 but are higher than 2024, suggesting sellers are still entering the market — just at a more moderate pace.
2. Median Sale Price Trend (2022–2026)
The median sale price story over the past five years shows a classic market cycle:
- 2022: Historic surge, peaking at $659,000 in May.
- 2023: Price correction begins, settling into the low–mid $500s.
- 2024: Continued normalization, with increased volatility.
- 2025: Stabilization in the low $500s before softening late in the year.
- January 2026: $445,000 — a notable reset from peak pricing.
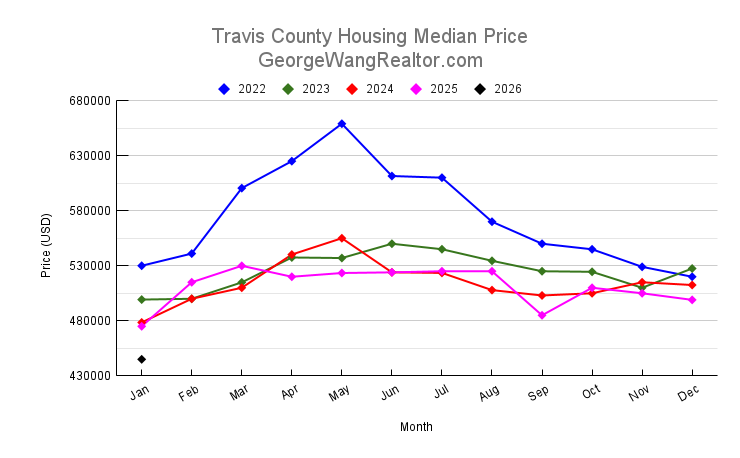
Overall, Travis County has experienced a substantial recalibration from the overheated 2022 market. Prices are now closer to pre-surge levels, improving affordability for buyers.
3. Months of Inventory Trend
Inventory tells perhaps the most important story:
- 2022: Extremely tight market (0.3–2.6 months early in the year).
- 2023: Rapid expansion, reaching over 4 months.
- 2024: Climbing further, peaking above 6 months.
- 2025: Frequently between 5–7 months — clearly favoring buyers.
- January 2026: 3.9 months — a meaningful contraction.
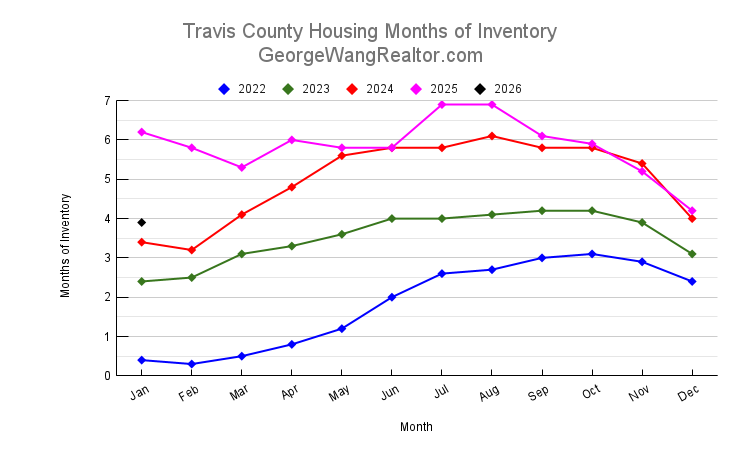
The drop from 6.2 months in January 2025 to 3.9 months today signals improving absorption. The market is moving away from oversupply and toward balance (generally defined as 4–6 months). If this trend continues, pricing pressure could stabilize.
4. Closed Sales Trend
Closed sales volume reflects demand patterns:
- 2022: Strong early-year demand.
- 2023–2024: Moderation as rates and affordability impacted buyers.
- 2025: Mixed performance, with softer late-year results.
- January 2026: 684 sales — slightly below recent January averages.
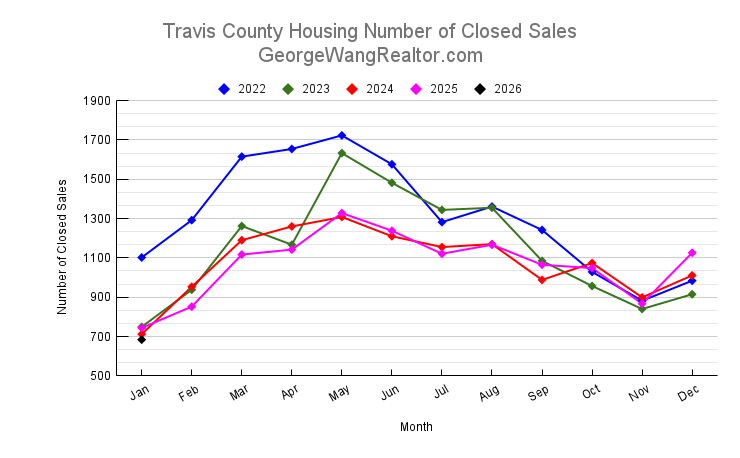
While activity remains below 2022 levels, the decline is not dramatic. The market appears cautious rather than collapsing.
5. New Listings Trend
New listings have fluctuated significantly:
- 2022: Aggressive listing activity during peak demand.
- 2023–2024: Elevated listing volume as sellers adjusted expectations.
- 2025: High inventory accumulation mid-year.
- January 2026: 1,624 new listings — down from 2025 but up from 2024.
This suggests sellers are becoming more strategic. Fewer listings entering the market combined with steady absorption could help rebalance supply and demand.
Market Interpretation
The Travis County housing market is no longer overheated — nor is it oversupplied at crisis levels. Instead, we are witnessing a normalization phase:
- Prices have corrected from pandemic-era highs.
- Inventory is retreating from 2025’s elevated levels.
- Buyer demand remains present but cautious.
- Sellers are adjusting expectations.
The key question moving forward will be whether reduced inventory continues tightening through spring 2026. If so, price declines may moderate.
Conclusion
January 2026 data shows a Travis County market in transition. Median prices are down year-over-year, closed sales remain modest, and inventory has improved significantly from last year’s peak. While sellers no longer hold the overwhelming advantage seen in 2022, the extreme buyer leverage of 2025 appears to be easing.
In short, the market is rebalancing.
For buyers, improved affordability and increased negotiating power remain attractive. For sellers, strategic pricing and strong presentation are more critical than ever. As 2026 unfolds, sustained inventory tightening and spring demand will determine whether stabilization — or further adjustment — lies ahead.