AUSTIN, Texas — In January, median home prices dropped 6.3% to $450,000, the largest price drop since July 2011, according to the Austin Board of REALTORS® latest Central Texas Housing Report. Despite the price decrease, monthly housing inventory stayed flat at 2.7 months of inventory from December 2022, demonstrating that this market is still in need of more housing as the industry standard is that six months of available inventory is considered a balanced market between buyers and sellers.
In January, residential home sales declined 27.3% year-over-year to 1,634 closed sales and sales dollar volume declined 29.1% to $917,954,115. New listings dropped 16% year-over-year to 2,988 listings while pending listings dropped 16.7% to 2,581 transactions. Monthly housing inventory increased 2.3 months to 2.7 months of inventory, and homes spent an average of 76 days on the market, up 47 days from January 2022, but only up three days from December 2022.
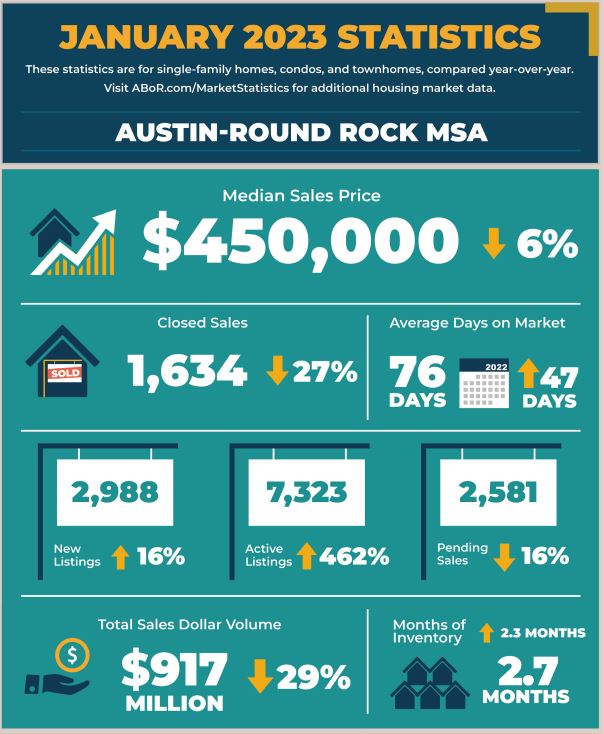
When looking at the added context of month-to-month changes from December 2022 to January 2023, in addition to a modest change in days on market, new listings increased 63.4% to 2,988 month-to-month. This demonstrates that sellers see opportunity in this market. At the same time, buyers also were more active in January 2023 compared to December 2022 as pending listings increased 32.4% to 2,581. Rising interest rates and affordable housing will be the major drivers challenging consumers this year.
City of Austin
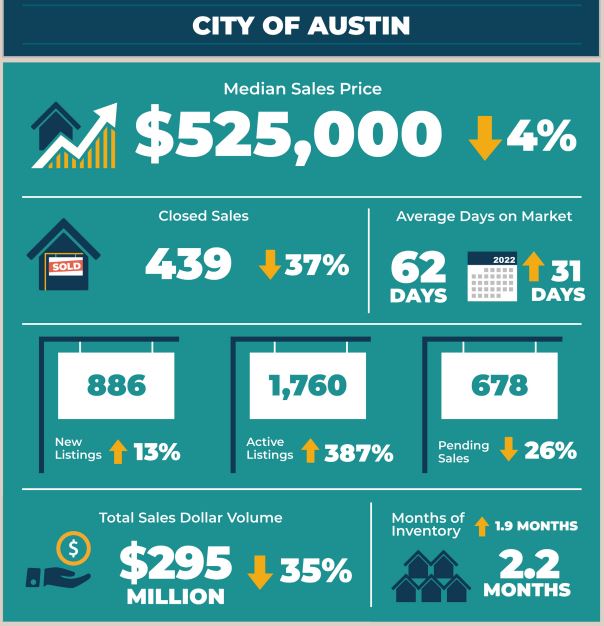
In January, home sales decreased 37.3% to 439 sales, while sales dollar volume decreased 35.0% to $295,909,860. At the same time, median price slightly decreased 4.6% to $525,000 for the City of Austin. Last month, new listings ticked up 13.0% to 886 listings, active listings skyrocketed 387.5% to 1,760 listings as pending sales declined by 26.0% to 678 pending sales. Monthly housing inventory increased 1.9 months year over year to 2.2 months of inventory.
Travis County
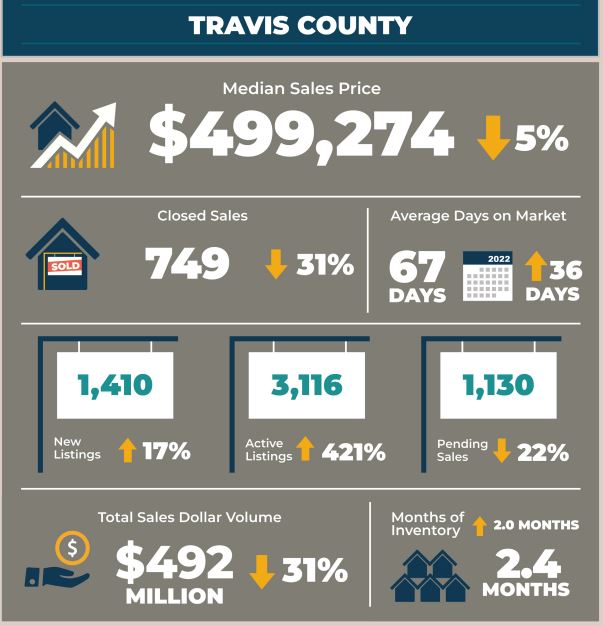
In Travis County, home sales decreased 31.7% to 749 sales, while sales dollar volume decreased 31.3% to $492,893,906. Last month, the median price in Travis County slightly dipped 5.9% year over year to $499,274, while new listings increased 17.0% to 1,410 listings and active listings ballooned 421.9% to 3,116 listings year over year. Pending sales declined 22.3% to 1,130 pending sales as monthly housing inventory increased 2.0 months year over year to 2.4 months of inventory.
Williamson County
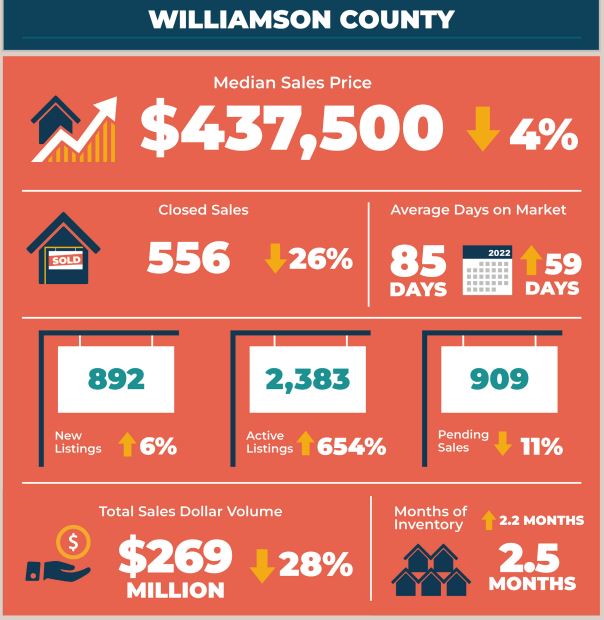
January home sales decreased 26.2% to 556 sales in Williamson County. Sales dollar volume declined 28.8% year over year to $269,359,523. The median price slightly decreased 4.9% to $437,500 as new listings ticked up 6.8% to 892 listings. During the same period, active listings soared 654.1% to 2,383 listings while pending sales dropped 11.4% to 909 pending sales. Housing inventory rose 2.2 months to 2.5 months of inventory.
Hays County
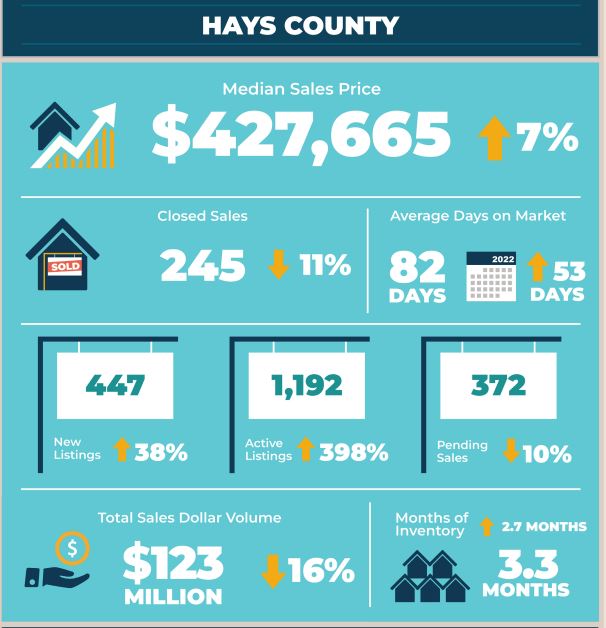
In Hays County, January home sales decreased 11.9% to 245 sales and sales dollar volume also dropped 16.7% to $123,838,974. The median price for homes rose 7.3% to $427,665. During the same period, new listings increased 38.4% to 447 listings, while active listings skyrocketed by 398.7% to 1,192 listings. Pending sales slightly decreased 10.1% to 372 pending sales as housing inventory jumped by 2.7 months to 3.3 months of inventory.
Bastrop County
Last month, Bastrop County home sales decreased 35.7% year over year to 63 sales, while sales dollar volume also fell by 39.2% to $24,904,074. Median price decreased 7.9% to $350,000 as new listings ticked up 5.2% to 163 listings. Active listings soared 319.3% to 499 listings as pending sales decreased 20.8% to 122 pending sales. Housing inventory increased by 3.2 months to 4.1 months of inventory, the highest level of inventory across the MSA in January.
Caldwell County
In Caldwell County, home sales decreased 4.6% year over year to 21 sales, and sales dollar volume also dropped 20.0% to $6,458,267. The median home price slightly rose 0.6% year over year to $316,750. At the same time, new listings increased by 31.0% to 76 listings as active listings skyrocketed 315.6% to 133 listings. Pending sales decreased 7.7% to 48 pending sales, and housing inventory increased 2.1 months to 3.1 months of inventory.
For more information or to download the January 2023 Central Texas Housing Market Report, visit ABoR.com/MarketStatistics.

