
The Travis County real estate market has undergone significant shifts from a strong seller’s market in 2022 to a more balanced, inventory-heavy market in 2025. Buyers now have more choices and negotiating power, while sellers face increasing competition. The median price appears stable, but ongoing inventory growth and moderating closed sales suggest the market may remain cooler unless demand surges later in the year.

1. Year-over-Year Comparisons (Latest Month) The latest data available is from February 2025. Compared to February 2024 and February 2023:
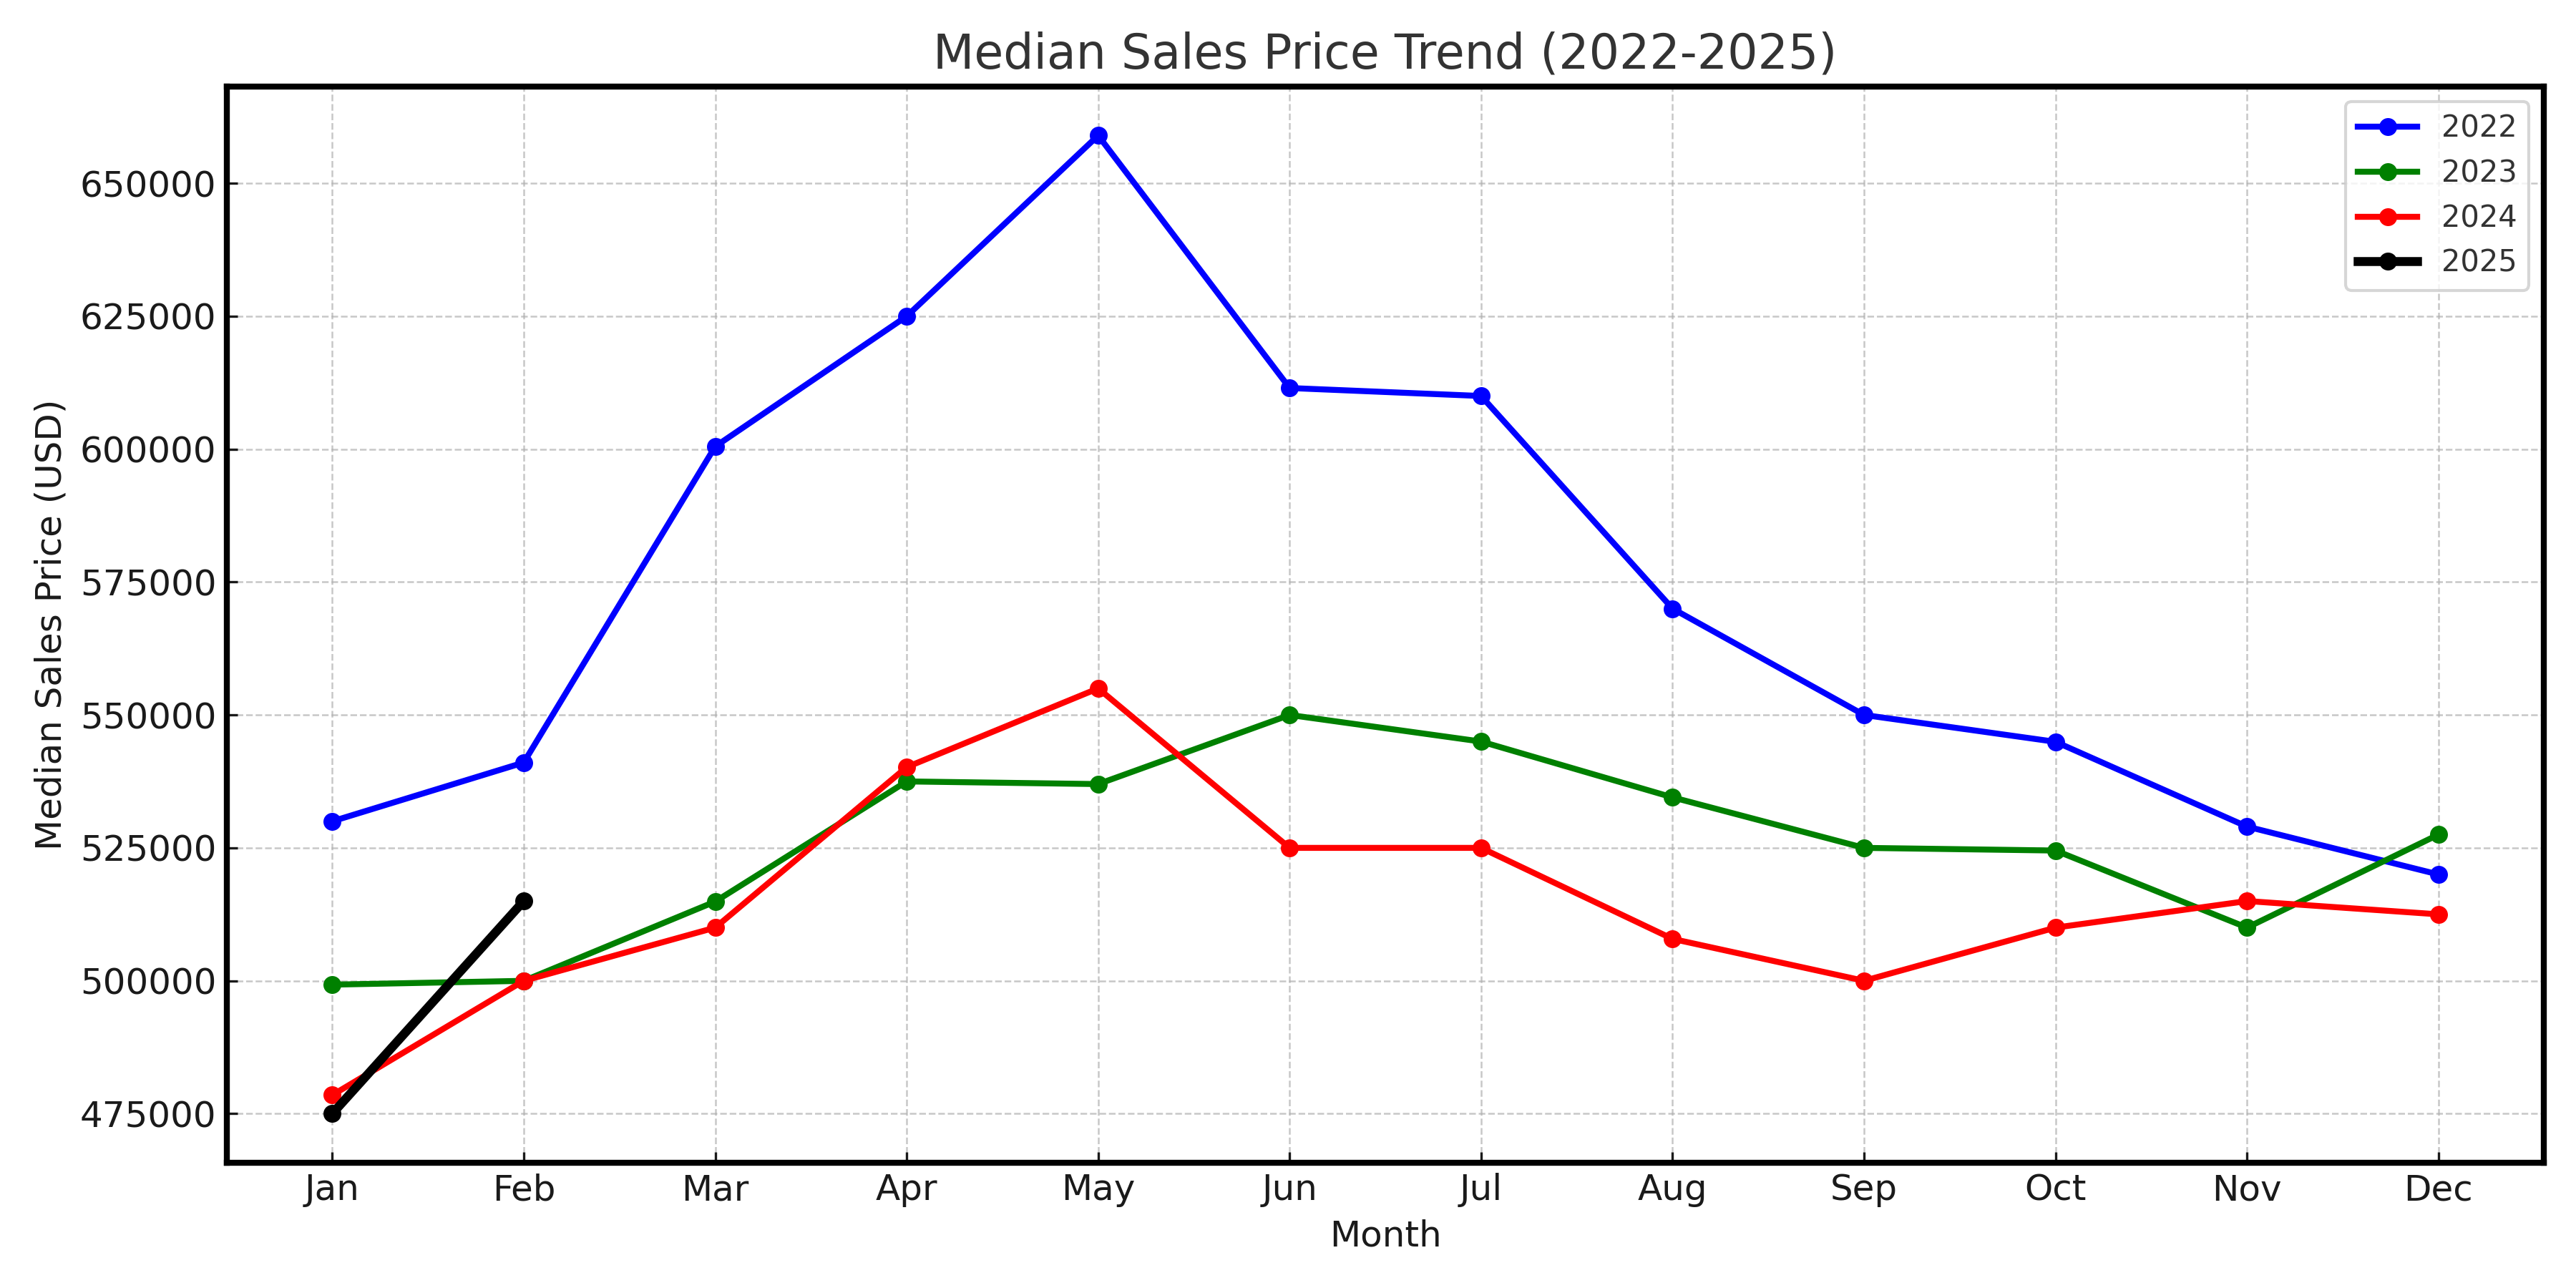
- Median Sales Price: $515,000 in Feb 2025 vs. $500,000 in Feb 2024 and $499,990 in Feb 2023. The price has rebounded after a slight dip in 2024 and is showing steady appreciation.
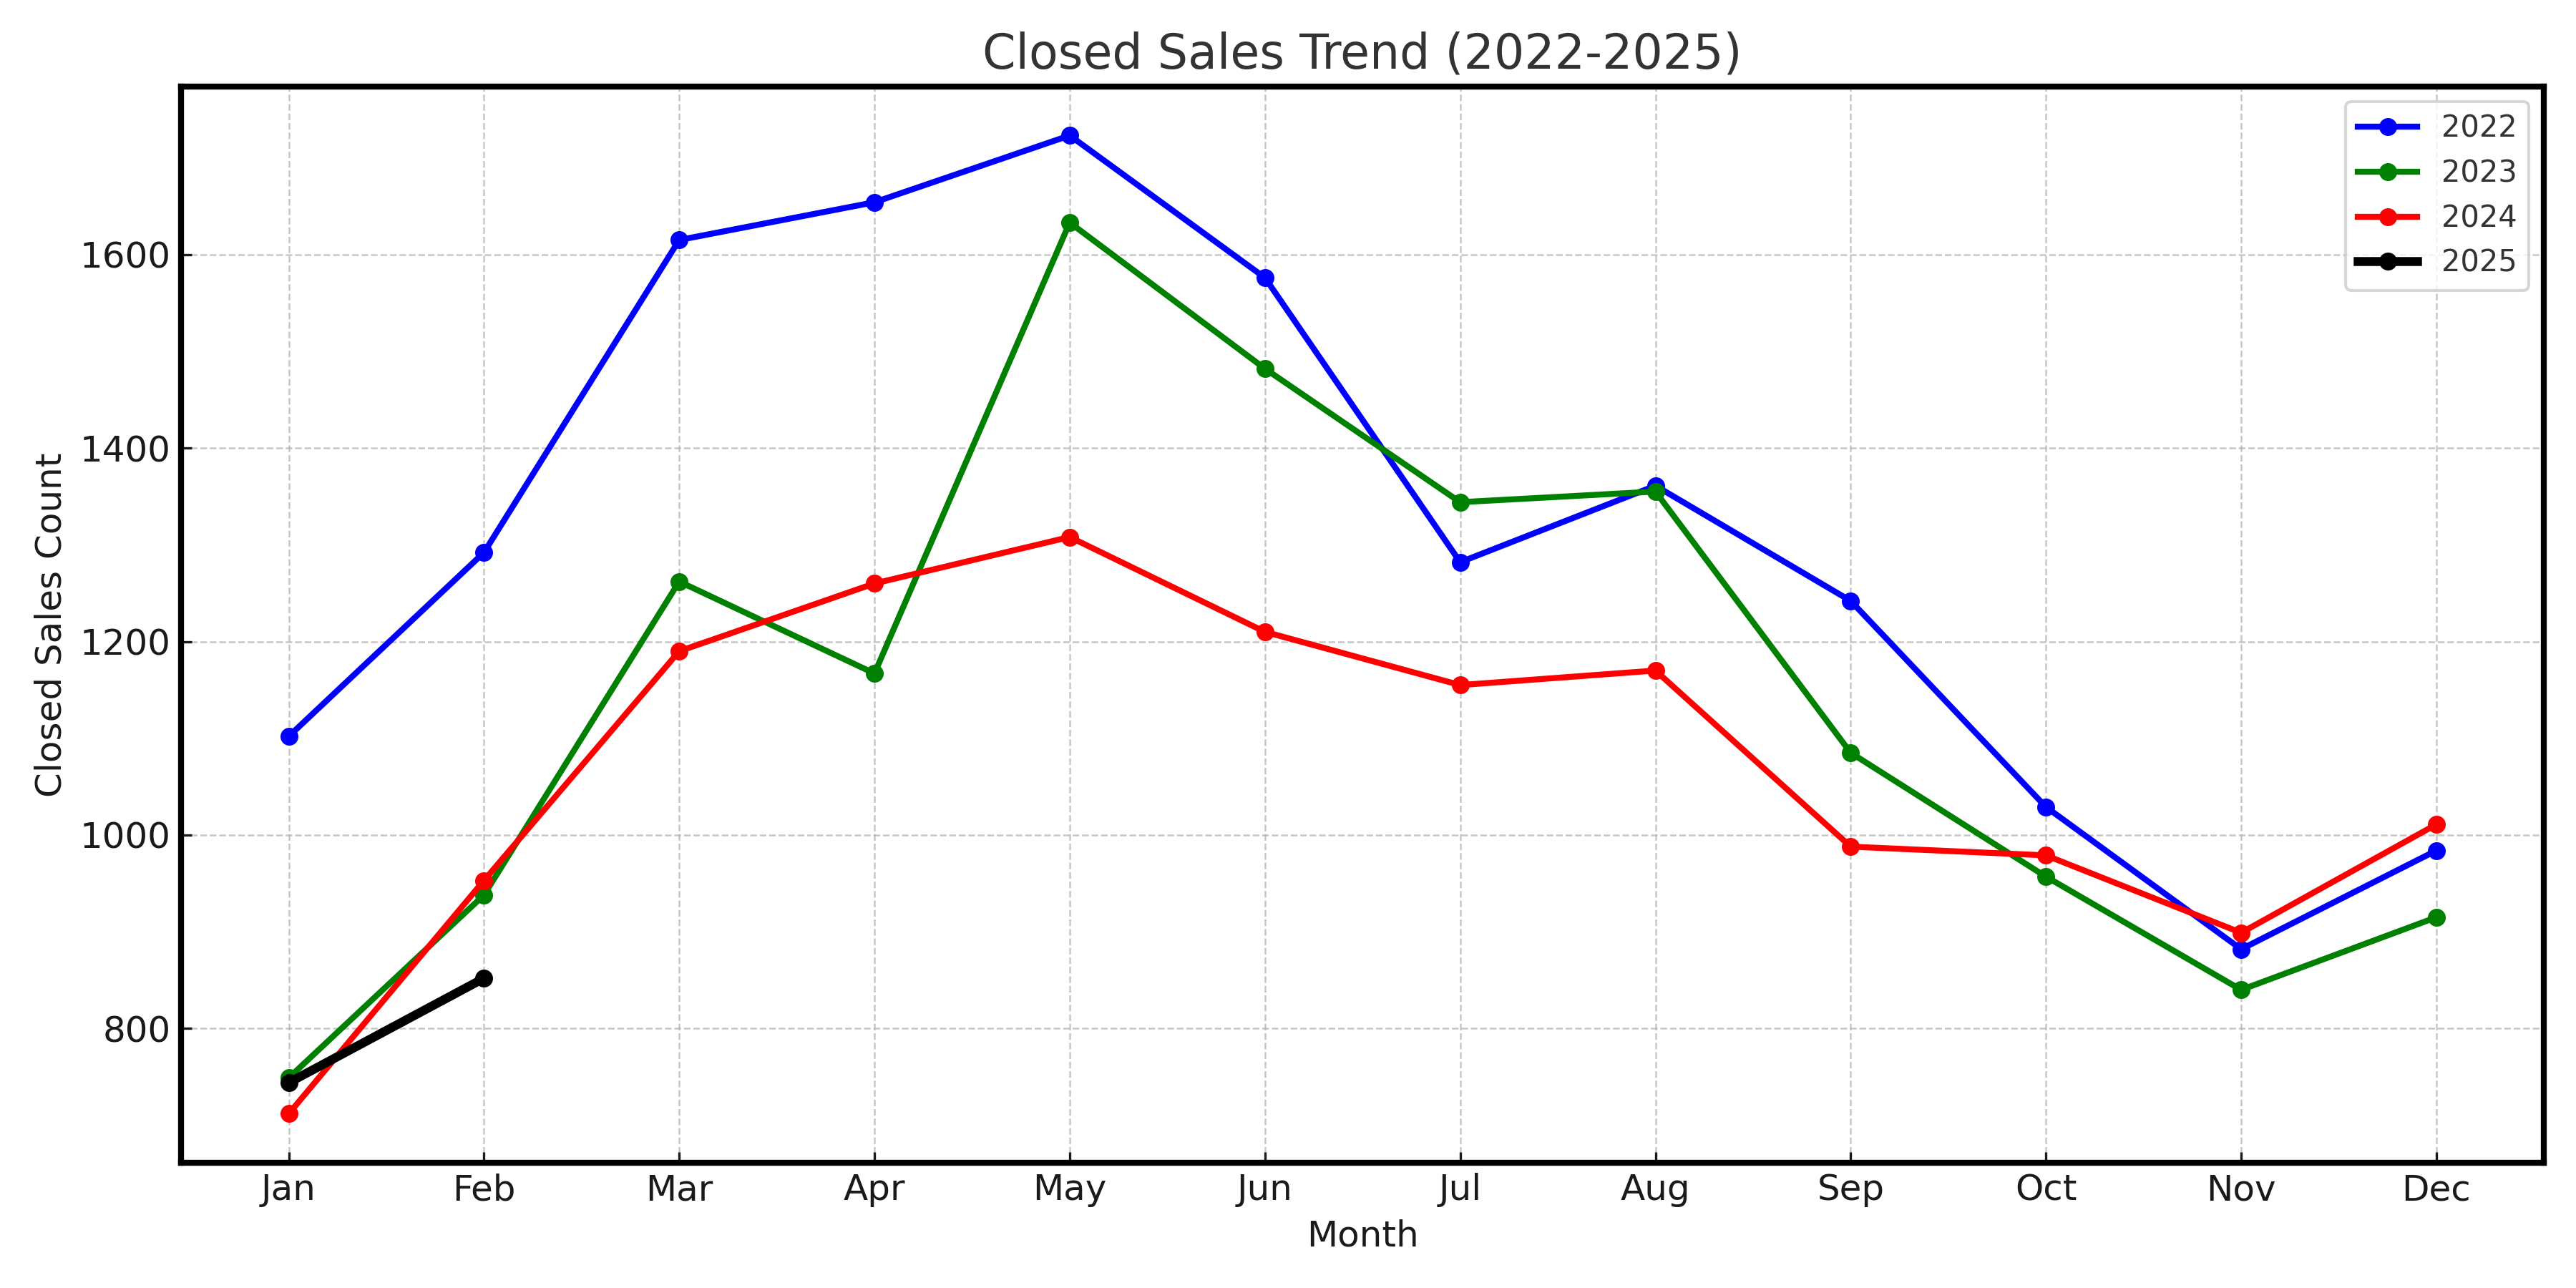
- Closed Sales: 852 in Feb 2025 vs. 953 in Feb 2024 and 938 in Feb 2023. Sales volume decreased slightly from last year, possibly reflecting buyer hesitancy due to higher inventory.
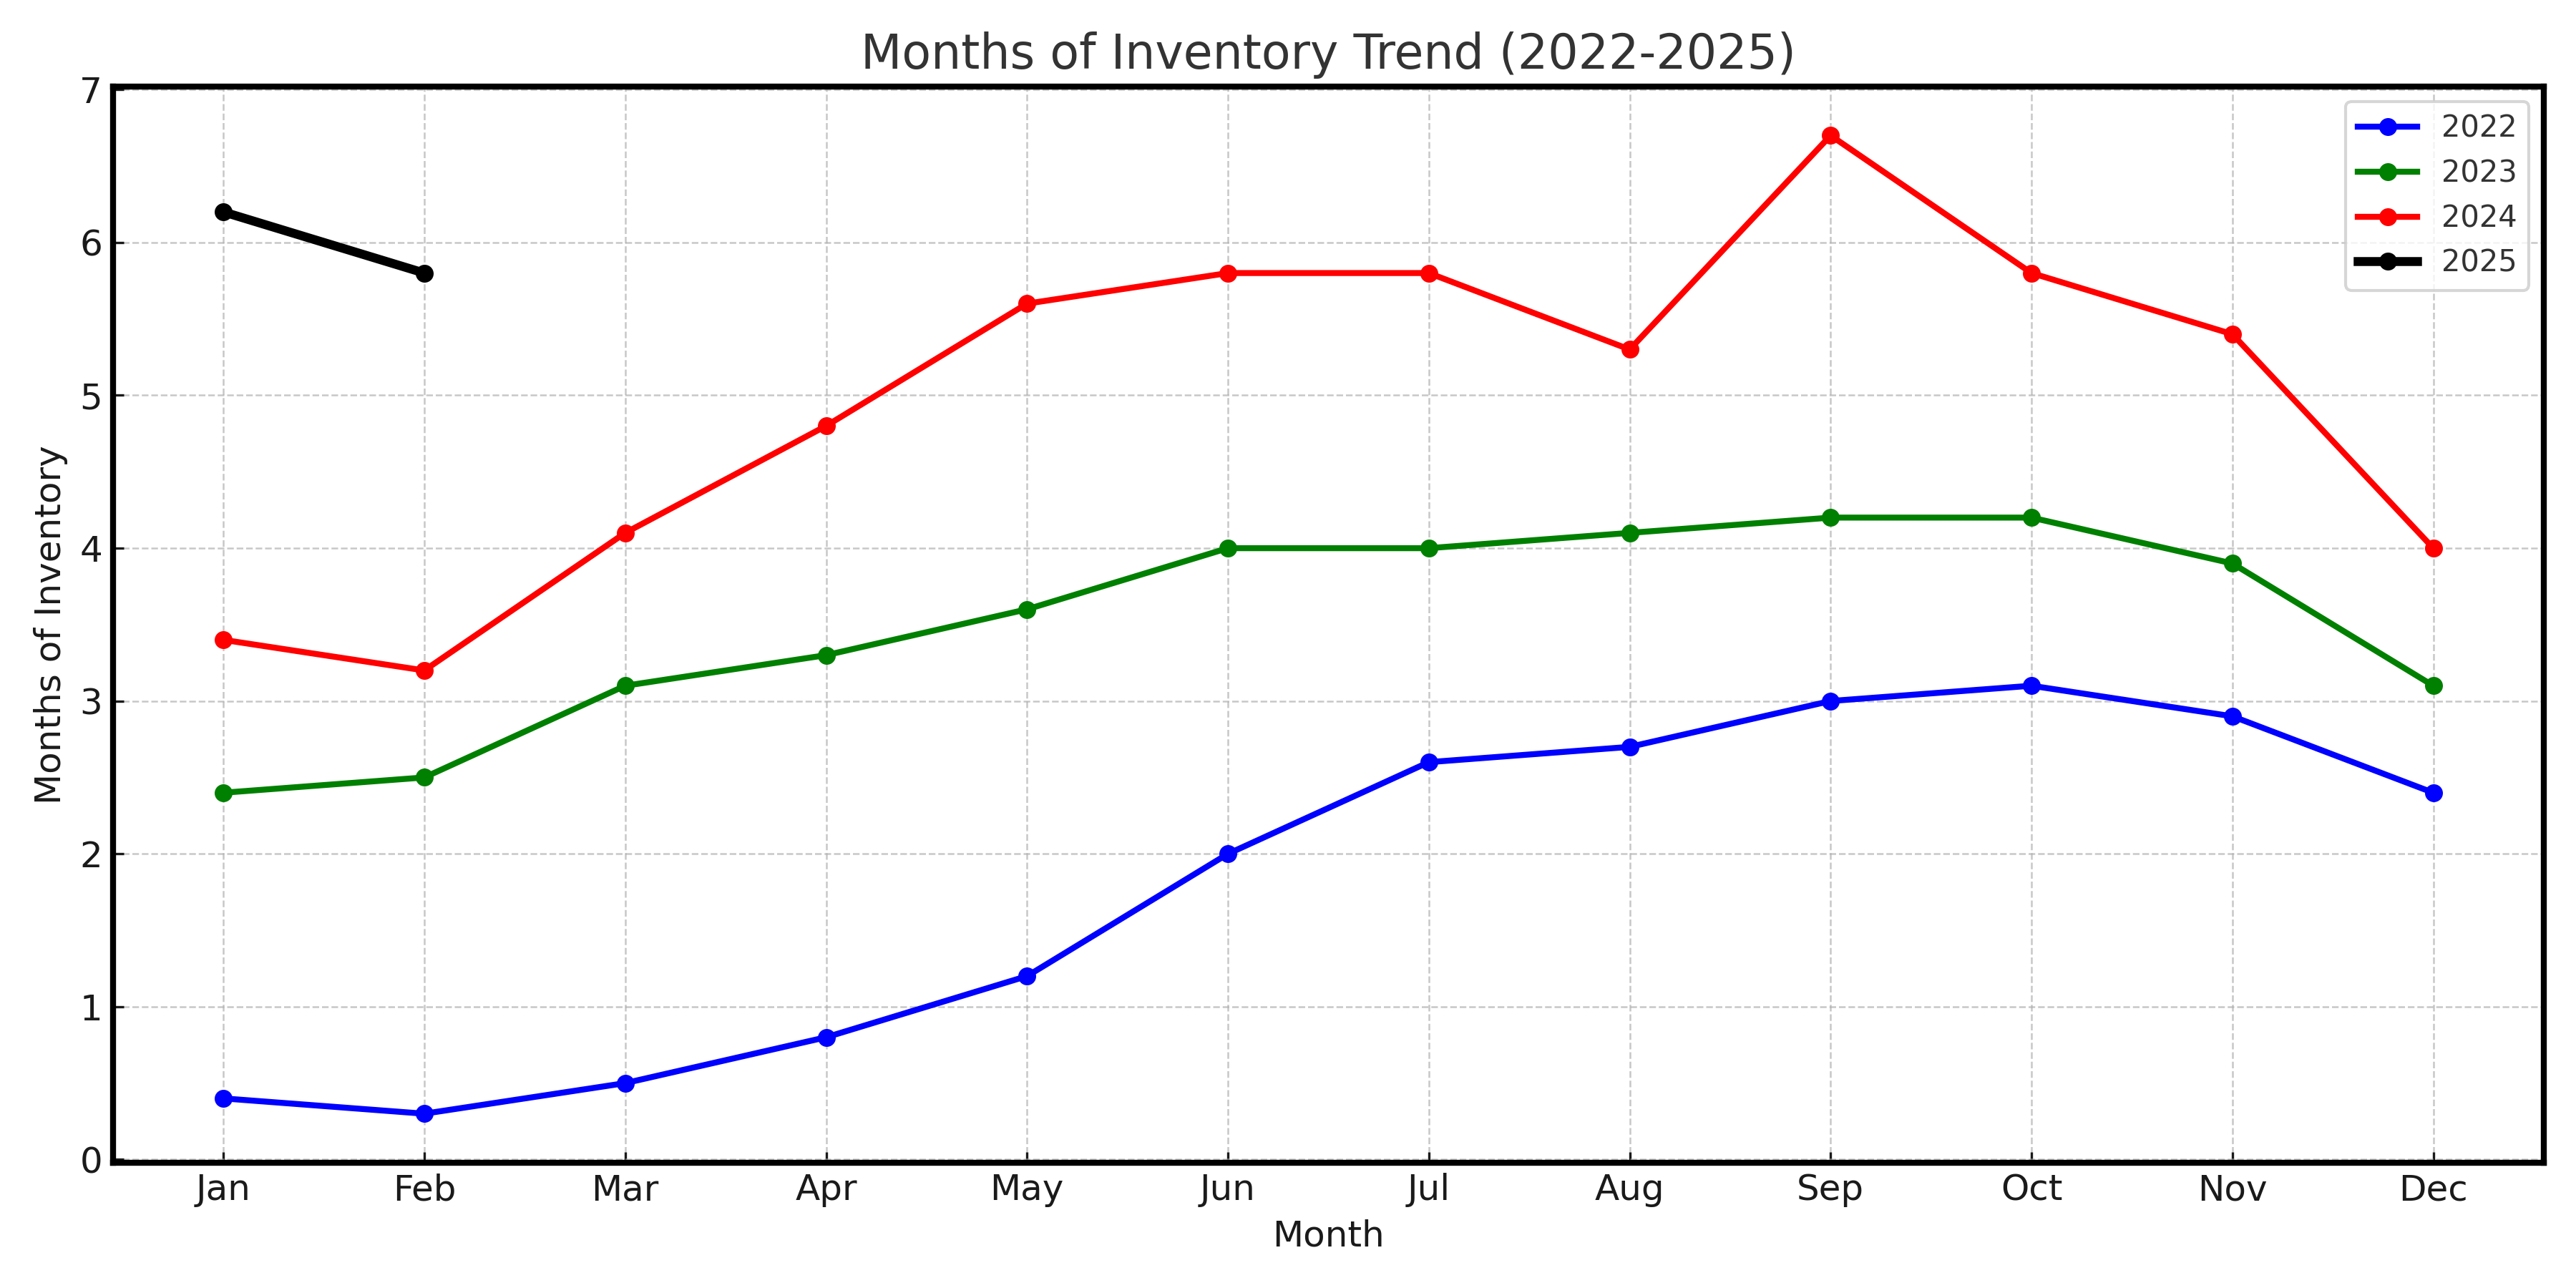
- Months of Inventory: 5.8 months in Feb 2025 vs. 3.2 months in Feb 2024 and 2.5 months in Feb 2023. Inventory levels have more than doubled in two years, indicating a shift towards a buyer’s market.
- New Listings: 1,863 in Feb 2025 vs. 1,958 in Feb 2024 and 1,411 in Feb 2023. Listing activity remains strong and consistent with an upward trend.
2. Median Sales Price Trend The median sale price peaked in May 2022 ($659,000) and then gradually declined to stabilize in the $500,000–$540,000 range from 2023 through early 2025. Despite market fluctuations, the market seems to be finding a stable floor in the $500,000–$515,000 range.
3. Months of Inventory Trend Inventory has steadily increased from less than 1 month in early 2022 to over 5 months in 2025. This reflects a clear transition from an extreme seller’s market to a more balanced or buyer-leaning market.
4. Closed Sales Trend Closed sales peaked in spring/summer 2022 and have generally declined, especially in the latter half of 2023 and throughout 2024. In 2025, early indications show modest stabilization.
5. New Listings Trend New listings have been on an upward trend from 2022 through 2024, with sellers more eager to list properties even as buyer activity slowed. In early 2025, this continues with strong listing numbers.
Stay tuned for future updates as we continue to monitor this evolving landscape.