The Travis County real estate market continues to evolve as higher inventory levels, moderating prices, and fluctuating sales activity reshape the region’s housing landscape. Using data from the Austin ABOR MLS covering 2022 through 2025, this analysis compares the latest available month—October 2025—with the same month in 2024, 2023, and 2022, while exploring long-term trends in median home prices, inventory, closed sales, and new listings.

1. Year-Over-Year Comparison: October 2025 vs. Prior Years
Median Sale Price
- October 2025: $510,000
- October 2024: $505,000 → +1% YoY
- October 2023: $524,500 → –2.8% from 2023
- October 2022: $544,950 → –6.4% from 2022
Takeaway:
Prices have recovered slightly from 2024 but remain below the peaks of 2022–2023. This suggests stabilization after a multi-year correction.
Closed Sales
- 2025: 1,048
- 2024: 1,074 → –2.4% YoY decline
- 2023: 957 → +9.5% above 2023
- 2022: 1,029 → +1.8% above 2022
Takeaway:
Closed sales remain relatively stable compared with historical averages, though slightly softer than 2024. Despite higher inventory, demand is steady—especially compared with the post-pandemic cooldown of 2023.
Months of Inventory
- 2025: 5.9
- 2024: 5.8 → Almost unchanged
- 2023: 4.2 → Significantly higher
- 2022: 3.1 → Much higher
Takeaway:
Inventory today is nearly double that of 2022 and materially higher than the balanced-market threshold (usually considered 4–6 months). Buyers have more negotiating power than in previous years.
New Listings
- 2025: 1,769
- 2024: 1,579 → +12% YoY
- 2023: 1,519 → +16% from 2023
- 2022: 1,561 → +13% from 2022
Takeaway:
New listings have climbed consistently, helping push inventory upward and reducing competitive pressure on buyers.
2. Median Sale Price Trend (2022–2025)
The median sale price has shown distinct cycles:
- Peak in 2022: Prices surged to all-time highs during the post-pandemic frenzy, topping out at $659,000 in May 2022.
- Correction in 2023: Prices fell sharply as interest rates rose and demand cooled, dipping into the high $400Ks.
- Stabilization in 2024–2025: Prices held mostly in the $500K–$530K range, showing mild recovery without overheating.
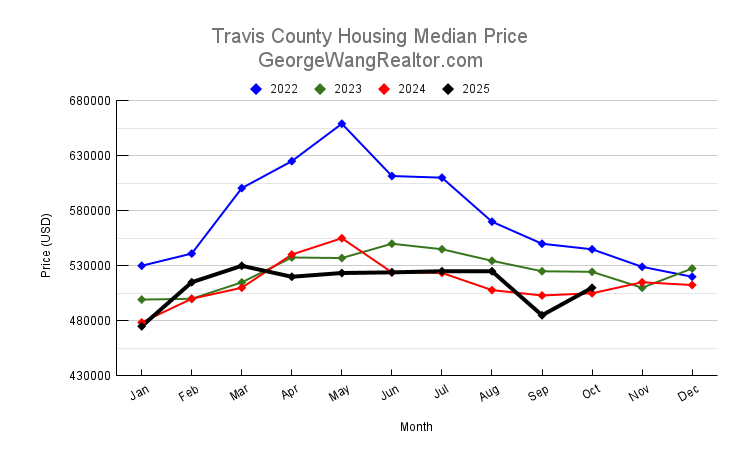
Overall Trend:
The wild price appreciation of 2022 has fully unwound, but the market has avoided a crash. Instead, it has settled into a more sustainable price band—still below the peaks, but supported by solid long-term demand and ongoing job growth in the Travis County metro.
3. Months of Inventory Trend
Inventory has been the largest structural shift in the market:
- 2022: 0.3–3 months → extreme seller’s market
- 2023: 2.4–4.2 months → approaching balance
- 2024: 3.2–6.1 months → strong shift toward buyer leverage
- 2025: 5.3–6.9 months → persistent high inventory
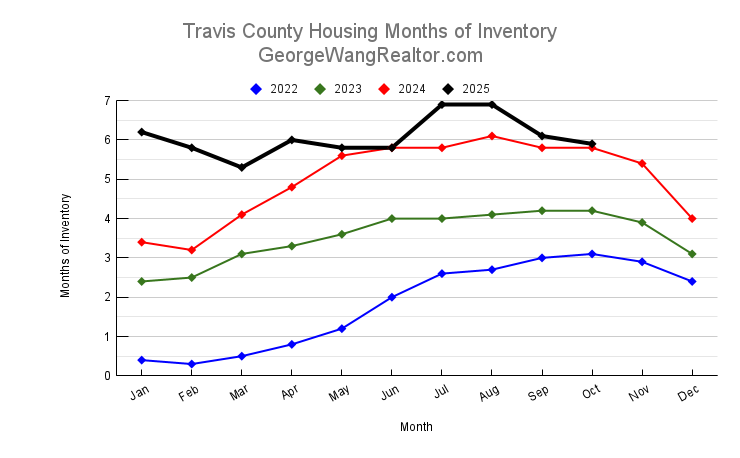
Overall Trend:
After years of historically low supply, the region now consistently shows balanced to buyer-leaning conditions. Sellers must price competitively and offer concessions, while buyers can take their time and negotiate stronger terms.
4. Closed Sales Trend
Closed sales follow a clear pattern:
- 2022: High sales volume driven by market momentum
- 2023: Significant drop as buyers retreated due to high rates and affordability challenges
- 2024: Stabilization with modest recovery
- 2025: Generally flat but holding steady despite higher inventory
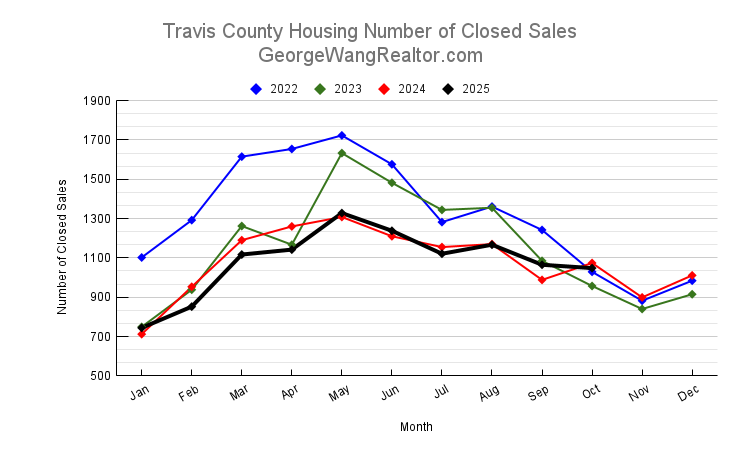
Overall Trend:
Demand has not collapsed; instead, it has normalized. The market is functioning with lower intensity than the 2020–2022 boom but stronger consistency than the mid-2023 slowdown.
5. New Listings Trend
New listings have increased meaningfully over the last three years:
- Low supply in 2022–2023 kept competition high
- 2024 brought a surge in sellers re-entering the market
- 2025 has continued the trend with even more new listings, especially in spring and early summer
This increase in new listings is the primary reason inventory has climbed and the market has shifted to more balanced conditions.
Conclusion
The Travis County housing market in 2025 is fundamentally different from the frenzied landscape of 2020–2022. Prices have stabilized, inventory has expanded substantially, and sales activity has leveled into a steady rhythm. Buyers now have more choices and bargaining power, while sellers must adapt to a more competitive environment. Despite higher supply, the market remains resilient, supported by ongoing population and economic growth. As we look ahead, the region is positioned for sustainable, measured real estate performance rather than the extreme volatility of recent years—creating a healthier and more balanced market for everyone involved.
If you have any questions or need any assistance in finding your new home or investment property, please contact me and I will be more than happy to work with you. You can read my client testimonials here.
Please also check out our rebate program which is a win-win situation for my buyer.