The Williamson County residential real estate market has seen a dynamic few years, marked by price fluctuations, inventory build-up, and evolving market activity. Using data from the Austin Board of Realtors MLS, we examine the latest trends from May 2025 and compare them to the same period in 2024 and 2023, while analyzing key market metrics including median sales price, closed sales, months of inventory, and new listings.

Year-Over-Year Comparison: May 2025 vs May 2024 & May 2023
Let’s compare May metrics from the past three years:
| Metric | May 2023 | May 2024 | May 2025 |
|---|---|---|---|
| Median Sales Price | $439,990 | $435,000 | $425,000 |
| Closed Sales | 1,113 | 1,000 | 1,024 |
| Sales Dollar Volume (B) | 0.559 | 0.490 | 0.495 |
| Months of Inventory | 2.8 | 3.9 | 4.4 |
| New Listings | 1,387 | 1,622 | 1,841 |
| Active Listings | 2,530 | 3,375 | 4,377 |
Key Takeaways:
- Median price dropped 3.4% from May 2023 and 2.3% from May 2024.
- Closed sales increased slightly this year but remain below 2023 levels.
- Inventory and listings have significantly increased, suggesting a more buyer-friendly market.
Median Sales Price Trend: Gradual Decline Since 2022
The median sale price peaked at $510,000 in mid-2022 and has trended downward since:
- 2022 average (May–Dec): ~$487K
- 2023 average (May–Dec): ~$427K
- 2024 average (May–Dec): ~$427K
- 2025 so far: ~$420K
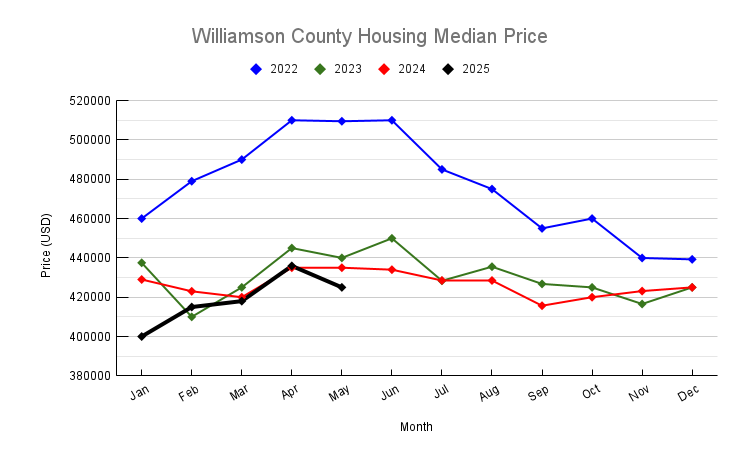
Though the drop from 2023 to 2025 is modest, the cumulative effect since 2022 marks a ~17% decline. The data suggests softening demand or seller competition pushing prices down.
Months of Inventory: A Shift Toward a Buyer’s Market
The months of inventory measure has risen steadily:
- May 2022: 1.1
- May 2023: 2.8
- May 2024: 3.9
- May 2025: 4.4
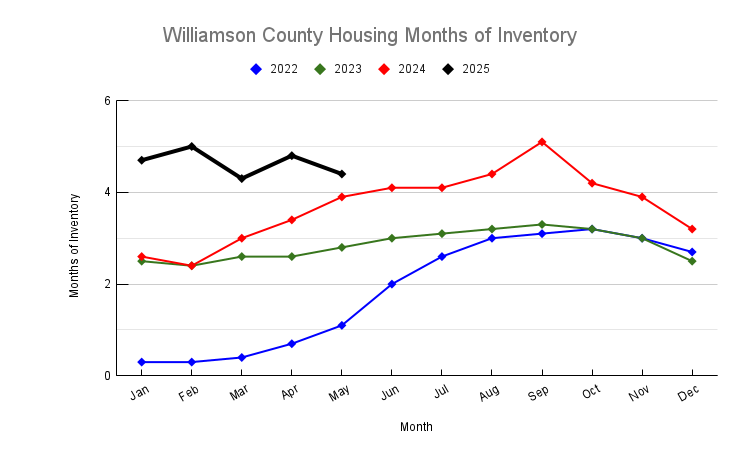
This rise reflects a growing supply of available homes. A balanced market is often considered 4–6 months of inventory. The current level implies Williamson County is nearing equilibrium but is increasingly leaning toward a buyer’s market.
Closed Sales: Stable but Below Peak Levels
Closed sales provide insight into real demand:
- May 2022: 1,210
- May 2023: 1,113
- May 2024: 1,000
- May 2025: 1,024
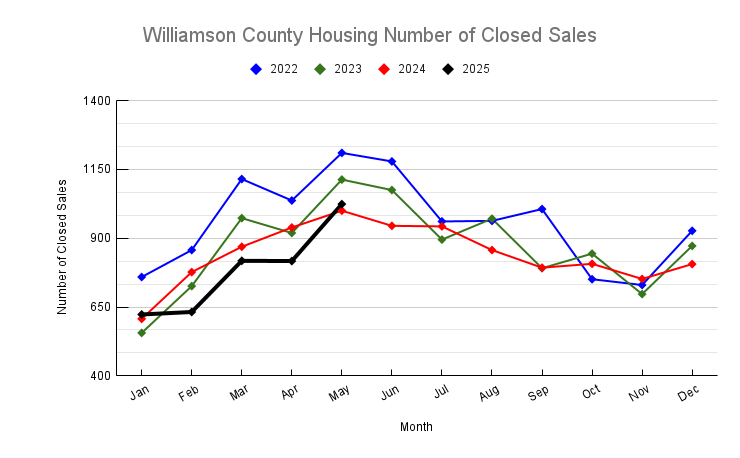
Sales fell sharply from 2022 to 2023 but have since stabilized. The minor uptick in 2025 could hint at a recovery, though not a sharp rebound.
New Listings: Supply Continues to Grow
New listings are a leading indicator of market activity. Here’s the progression for May:
- 2022: 1,692
- 2023: 1,387
- 2024: 1,622
- 2025: 1,841
The surge in 2025 new listings—up 33% from 2023—suggests more homeowners are testing the market, possibly anticipating rate adjustments or trying to sell before further depreciation.
Conclusion: Market Leans Toward Buyers Amid Rising Inventory
The Williamson County housing market in May 2025 reflects a continued cooling trend that began in mid-2022. Prices have declined moderately, and inventory has climbed steadily, signaling stronger negotiating power for buyers. While closed sales have steadied, the influx of listings and the increase in months of inventory point to a market that is shifting away from its pandemic-era seller-driven dynamics.
Buyers now enjoy more choices and potentially better deals, while sellers must adapt to more competitive conditions by pricing appropriately and ensuring homes are market-ready. As always, local market conditions can vary block by block, so partnering with a real estate professional remains key.
If you have any questions or need any assistance in finding your new home or investment property, please contact me and I will be more than happy to work with you. You can read my client testimonials here.
Please also check out our rebate program which is a win-win situation for my buyer.