As we wrap up the first half of 2025, Travis County’s residential real estate market continues to shift under the weight of interest rate changes, affordability pressures, and inventory fluctuations. We analyzed data for May from the past three years to track how key metrics have evolved and what trends are emerging across the market.

Year-over-Year Market Comparison – May 2025 vs May 2024 and May 2023
| Metric | May 2023 | May 2024 | May 2025 | % Change 2024–2025 | % Change 2023–2025 |
|---|---|---|---|---|---|
| Median Sale Price | $537,000 | $555,000 | $525,000 | -5.4% | -2.2% |
| Closed Sales | 1,633 | 1,308 | 1,328 | +1.5% | -18.7% |
| Sales Volume (B$) | 1.19 | 0.965 | 0.971 | +0.6% | -18.4% |
| Months of Inventory | 3.6 | 5.6 | 5.8 | +3.6% | +61.1% |
| New Listings | 2,256 | 2,611 | 2,780 | +6.5% | +23.2% |
The May 2025 data paints a picture of a softening market in terms of price, while sales volume and transaction count have stabilized compared to last year. Inventory is building up — now at 5.8 months — signaling increased buyer leverage.
Median Sale Price Trend: Plateauing After Pandemic Spike
Travis County’s median sale price hit a peak of $659,000 in May 2022 and has generally trended downward since:
- 2022 May: $659,000
- 2023 May: $537,000 (↓18.5% YoY)
- 2024 May: $555,000 (↑3.4% YoY)
- 2025 May: $525,000 (↓5.4% YoY)
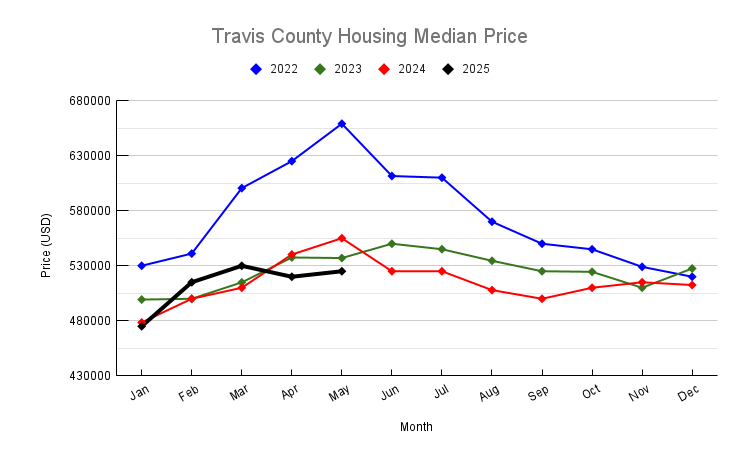
After a brief rebound in 2024, prices are softening again. This suggests buyers are gaining more negotiating power amidst rising supply and affordability constraints. The market may be nearing a new equilibrium post-pandemic.
Months of Inventory: Supply Levels Highest in Years
Inventory levels have more than doubled since 2022:
- May 2022: 1.2 months
- May 2023: 3.6 months
- May 2024: 5.6 months
- May 2025: 5.8 months
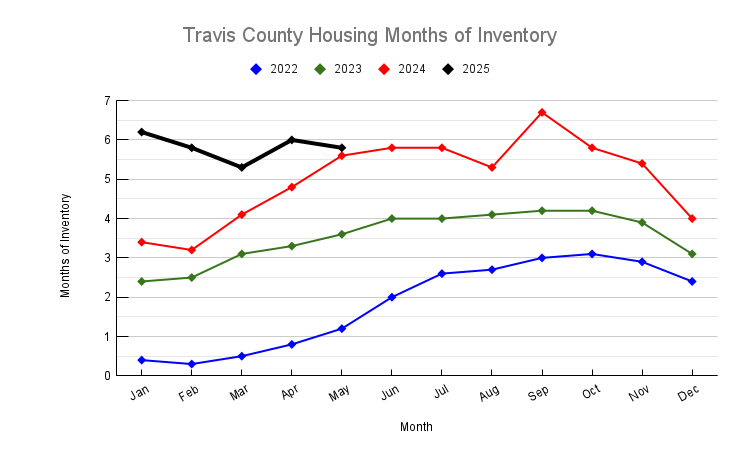
This rapid increase indicates a cooling market, with homes staying on the market longer and more options available for buyers. This shift strongly favors a buyer’s market — a significant contrast from the ultra-competitive conditions of 2021–2022.
Closed Sales: Modest Recovery After Steep Declines
Closed sales dropped from 1,723 in May 2022 to a low of 1,308 in May 2024. May 2025 showed a slight recovery to 1,328 — up 1.5% from the prior year but still 23% below 2022 levels.
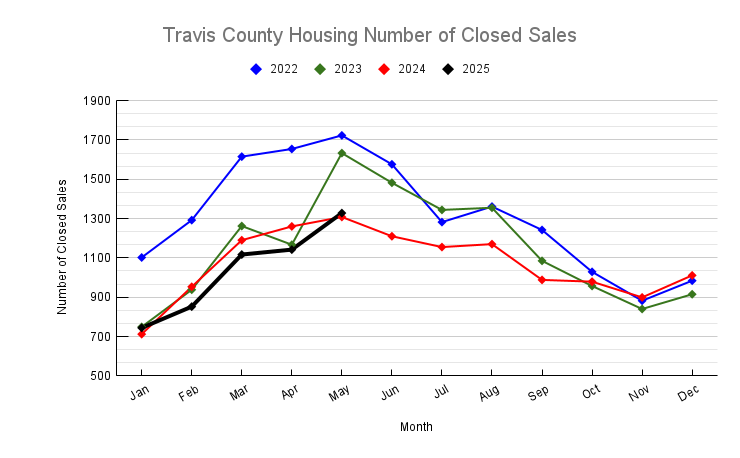
The rebound in 2025 suggests a market trying to regain balance. Increased inventory and stable pricing may have encouraged more buyers to step in, though volume is still below pre-2023 levels.
New Listings: Sellers Return to Market
New listings are climbing again:
- May 2022: 2,456
- May 2023: 2,256
- May 2024: 2,611
- May 2025: 2,780
This represents a 6.5% YoY increase and a 23% rise over 2023. Seller confidence appears to be returning, likely driven by stabilizing rates and pent-up demand from would-be movers who paused in 2023.
Conclusion
Travis County’s residential market continues to shift in 2025 as it digests the rapid changes of the past few years. After a pandemic-era boom followed by a cooldown, the market now shows signs of stabilization. Median prices have flattened, sales have steadied, and inventory continues to rise — giving buyers more room to negotiate.
The next few months will be pivotal. If interest rates decline or plateau, demand could strengthen. However, if inventory continues to rise without matching buyer activity, further price adjustments may follow.
If you have any questions or need any assistance in finding your new home or investment property, please contact me and I will be more than happy to work with you. You can read my client testimonials here.
Please also check out our rebate program which is a win-win situation for my buyer.